Income inequality – the gap in incomes between the rich and poor – has increased steadily in the United States since the 1970s. By one measure, the gap between Americans at the top and the bottom of the income ladder increased 27% from 1970 to 2016. However, the rise in inequality within America’s racial and ethnic communities varies strikingly from one group to another, according to a new Pew Research Center analysis of government data.
In this analysis, which draws on data from the American Community Survey and U.S. decennial censuses, income inequality is measured using the 90/10 ratio – the income of those at the high end (90th percentile) of the income distribution relative to the income of those at the low end (10th percentile). “Income” refers to the resources available to a person based on the income of their household, whether the person had personal earnings or not. Thus, people’s incomes are represented by their household’s income adjusted for household size. (See the report methodology for details.)
Here are five key findings from the report:
1 Income inequality in the U.S. is now greatest among Asians. In 2016, the latest year for which data are available, Asians near the top of their income distribution (the 90th percentile) had incomes 10.7 times greater than the incomes of Asians near the bottom of their income distribution (the 10th percentile). The 90/10 ratio among Asians was notably greater than among blacks (9.8), whites (7.8) and Hispanics (7.8).
2Income inequality among Asians in the U.S. nearly doubled from 1970 to 2016. The top-to-bottom income ratio among Asians increased 77% from 1970 to 2016, a far greater increase than among whites (24%), Hispanics (15%) or blacks (7%). As a result, Asians displaced blacks as the most economically divided racial or ethnic group in the U.S. In 1970, income inequality among Asians was roughly on par with whites and Hispanics and significantly less pronounced than it was among blacks. The Asian experience with inequality reflects the fact that the incomes of Asians near the top increased about nine times faster than the incomes of Asians near the bottom from 1970 to 2016, 96% compared with 11%. These were the greatest and the smallest increases in incomes at the two rungs of the ladder among the racial and ethnic groups analyzed.
3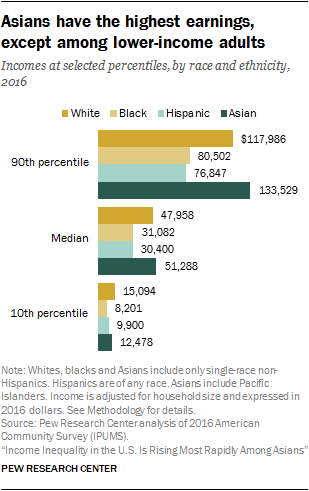 Asians overall are the highest-earning racial and ethnic group in the U.S., but it is not a status shared by all Asians. In 2016, the median annual income for Asian adults was $51,288, compared with $47,958 for whites, $31,082 for blacks and $30,400 for Hispanics. (The median is the 50th percentile – the middle – of the income distribution.) Asians at the top of their income distribution earned more than others at the top of their distributions, earning 13% more than whites at the 90th percentile and leading Hispanics and blacks by wider margins. Lower-income Asians (at the 10th percentile) earned more than lower-income Hispanics and blacks in 2016, but their earnings fell short of the earnings of lower-income whites by 17%.
4Income gaps across racial and ethnic groups persist and, in some cases, are wider than in 1970. Large gaps between the incomes of blacks and whites have narrowed only modestly in recent decades. In 2016, blacks at the 90th percentile of their distribution earned 68% as much as whites at their 90th percentile, the same as in 1970. At the median, blacks earned 65% as much as whites in 2016, up from 59% in 1970. Similarly, lower-income blacks narrowed the gap slightly from 47% in 1970 to 54% in 2016.
While the income gap between blacks and whites closed somewhat from 1970 to 2016, Hispanics fell even further behind at all income levels. For example, at the high end of the income distribution, Hispanics earned 65% as much as whites in 2016 compared with 74% in 1970. Higher-income Asians moved further out in front of higher-income whites, but lower-income Asians did not keep pace. Asians at the 10th percentile earned 8% more than whites in 1970, but in 2016 they earned 17% less.
5The Asian and Hispanic experiences with inequality are partly driven by immigration patterns. Immigrants accounted for 81% of the growth in the Asian adult population in our sample from 1970 to 2016. This surge followed the Immigration and Nationality Act in 1965, drawing migrants from many countries for family reunification or as refugees, and later through skill-based programs such as the H-1B visa program. The result is a wide variation in education levels and incomes among Asians in the U.S. In 2015, the share with at least a bachelor’s degree among adults ages 25 and older ranged from 9% among Bhutanese to 72% among Indians, median household income varied from $36,000 among Burmese to $100,000 among Indians, and poverty rates were as high as 35% among Burmese and 33% among Bhutanese (incomes not adjusted for household size).
Hispanic immigrants, many of whom were unauthorized, accounted for 50% of the growth in the Hispanic adult population in our sample from 1970 to 2016. The Hispanic immigrant population tilts to the lower end of the education and income distributions. In 2015, 47% of foreign-born Hispanics ages 25 and older had not graduated from high school, compared with 13% of Americans overall. And only 11% of Hispanic immigrants had attained at least a bachelor’s degree, compared with 31% of Americans overall. The influx of lower-skill, lower-income immigrants likely exerted a drag on the measured growth in income for Hispanics.
Overall, the contrasting experiences of America’s racial and ethnic groups with income inequality – as well as the persistence of gaps in income across them – could reflect differences in the characteristics of workers, such as educational attainment (greater among Asians and whites) and the share foreign born (greater among Asians and Hispanics). In addition, the historical legacy and current impact of discrimination are considered to be an important source of gaps in income across groups.