The stark demographic and educational divisions that have come to define American politics were clearly evident in voting preferences in the 2018 congressional elections.
There were wide differences in voting preferences between men and women, whites and nonwhites, as well as people with more and less educational attainment.
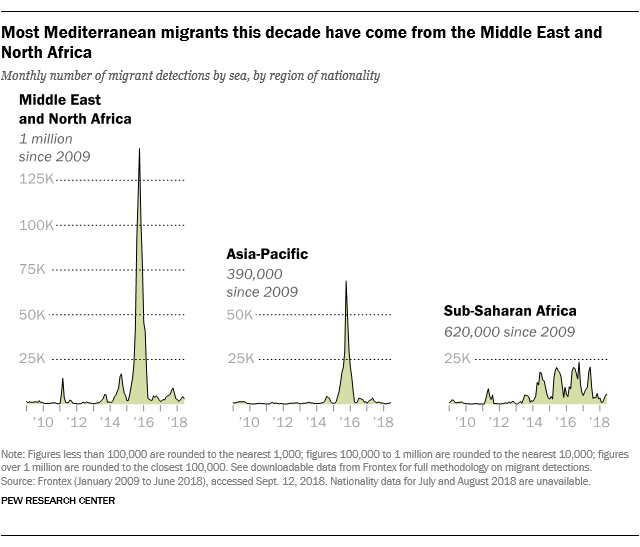
Nationally, voters favored Democratic candidates for Congress over Republican candidates by a margin of about 7 percentage points, according to a preliminary estimate by The New York Times. (With votes still being tabulated in some states, this margin may change.) Democrats won a majority in the House of Representatives for the first time since 2010, while Republicans appear to have added to their majority in the Senate.
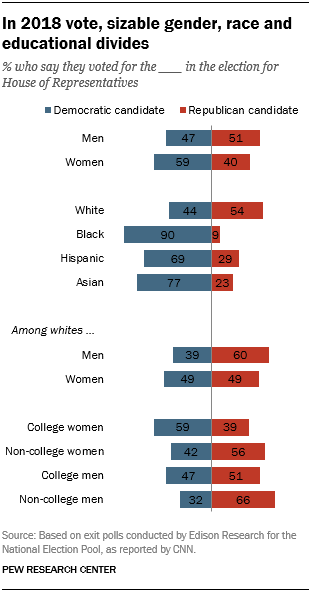
The gender gap in voting preference is not new, but it is at least as wide as at any point over the past two decades, according to exit polls by the National Election Pool, as reported by CNN. Women favored the Democratic candidate in their district by 19 percentage points (59% to 40%) while men voted for the Republican 51% to 47%. (The exit polls offer the first look at the electorate; the portrait will be refined over time as additional data, such as state voter files, become available).
The exit polls show divisions across racial and educational groups, too. As was the case in the 2016 presidential election, white men voted Republican by a wide margin (60% to 39%) while white women were divided (49% favored the Democratic candidate; as many supported the Republican).
Blacks voted overwhelmingly (90%) for the Democratic candidate, including comparable shares of black men (88%) and black women (92%).
(For more on long-term trends in voters’ party identification, see “Wide Gender Gap, Growing Educational Divide in Voters’ Identification.” For a detailed study of demographic divisions in the 2016 electorate based on voter records, see “For Most Trump Voters ‘Very Warm’ Feelings for Him Endured.”)
When gender, race and education are considered together, women college graduates stand out for their strong preference for the Democratic candidate (59% favored the Democrat while just 39% voted Republican). Whites with less education – particularly men – supported the Republican. White men who do not have a college degree voted Republican by about two-to-one (66% to 32%).
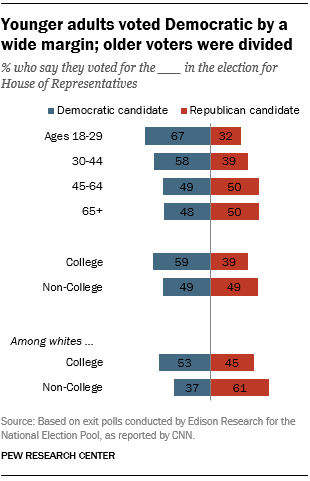
The age divide in voting, which barely existed in the early 2000s, also is large. Majorities of voters ages 18 to 29 (67%) and 30 to 44 (58%) favored the Democratic candidate. Voters ages 45 and older were divided (50% Republican, 49% Democrat).
Among voters who said this was the first midterm in which they voted, 62% favored the Democrat and just 36% supported the Republican.
As is typically the case with midterm elections, views of the president were a major factor in the outcome. In September, Pew Research Center found that a majority of registered voters (60%) said they viewed their vote as either a vote for or against President Donald Trump.
The national exit poll found that more voters said their midterm vote was to oppose Trump (38%) than said it was to support him (26%); 33% said Trump was not a factor in their vote. The midterm vote also was highly correlated with views of Trump’s job performance: Among those who approved of the president (45% of all voters), 88% voted for the Republican. Among the larger share who disapproved (54%), an overwhelming percentage voted Democratic (90%).
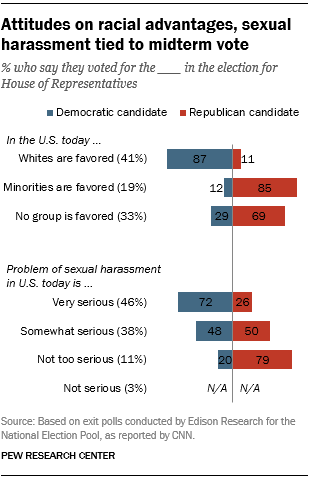
In a year in which issues around gender and racial diversity have been key issues in politics, voters were divided in their opinions about whether whites or minorities are favored in the country today and whether sexual harassment is a serious problem in the U.S.
Overall, 41% of voters said whites in the country today are favored over minorities; 19% said that minorities are favored over whites, while 33% said that no group is favored. Attitudes on this question were strongly correlated with vote choice. Among those who said whites are favored in the U.S., 87% voted for Democrats. By contrast, large majorities of those who said minorities are favored (85%) or that no group is favored (69%) voted for Republican candidates.
Views of the seriousness of the problem of sexual harassment also were closely tied to midterm preferences: 72% of those who said it is a very serious problem supported Democratic candidates. Among those who said it was a somewhat serious problem, Republican candidates held a slim edge (50% vs. 48%). And while relatively few voters said sexual harassment is not too serious a problem (11%), this group voted overwhelmingly Republican (79% vs. 20%).
Related posts:
How religious groups voted in the midterm elections
Key takeaways about Latino voters in the 2018 midterm elections
