Social trust is a belief in the honesty, integrity and reliability of others – a “faith in people.” It’s a simple enough concept to describe. But it’s never been easy to figure out who trusts, or why.
A new Pew Social Trends Survey is far from the last word on a subject that has bedeviled philosophers and social scientists through the ages, but it can provide base-line answers to some questions and tantalizing hints about others.
The telephone survey asked a nationally representative sample of 2,000 adults three questions designed to measure their level of social trust.
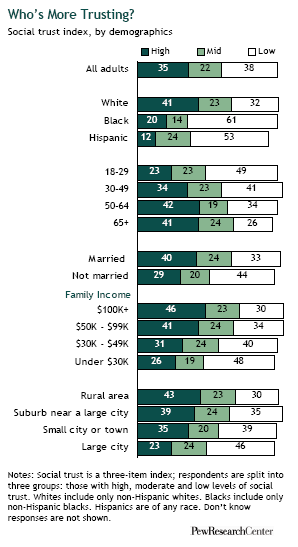
It found that whites are more trusting than blacks or Hispanics.1 People with higher family incomes are more trusting than those with lower family incomes. The married are more trusting than the unmarried. The middle-aged and the elderly are more trusting than the young. People who live in rural areas are more trusting than those who live in cities.
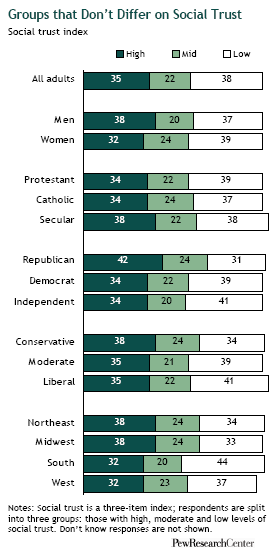
By contrast, the survey also found that there are some demographic and political traits that have little or no correlation to levels of social trust. Men and women; Republicans and Democrats; liberals and conservatives; Protestants and Catholics and the secular — all of these groups have roughly similar levels of trust.
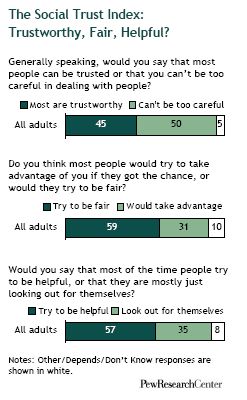
As for the population as a whole, Americans are closely divided on the following question: “Generally speaking, would you say that most people can be trusted or that you can’t be too careful in dealing with people?” Some 45% of respondents in the Pew survey say the former, while 50% say the latter.
These responses have fluctuated very little during the four decades that survey research organizations have been asking this question, save for a period in the 1990s when measured levels of interpersonal trust dipped for a number of years, triggering a flurry of speculation and scholarship about the reasons for the decline. But since then, social trust has rebounded to roughly the same level it had been before the trough.2
The new Pew survey did not probe into the psyches, values or the life experiences of respondents, so it can offer no clues about how these factors might affect a given individual’s inclination to trust other people. Rather, it provides a look at how different demographic groups responded to a battery of three questions about social trust:
- Generally speaking, would you say that most people can be trusted or that you can’t be too careful in dealing with people? Some 45% of respondents said most people can be trusted.
- Do you think most people would try to take advantage of you if they got the chance, or would they try to be fair? Some 59% of respondents said most people try to be fair.
- Would you say that most of the time people try to be helpful, or that they are mostly just looking out for themselves? Some 57% of respondents said most people try to be helpful.
When we combined the answers into an index of social trust, we were able to place respondents into one of three categories: those with high (35%), moderate (22%) and low (38%) levels of social trust.
An International Perspective
The question of what explains social trust – and why certain societies are more trusting than others – has long fascinated social scientists. Many theories have been advanced – personal optimism; voluntary associations; homogeneous societies; equal opportunities; honest governments – but over the years, not all have stood up to empirical scrutiny. Cross-national surveys have found that the highest levels of social trust are in the homogeneous, egalitarian, well-to-do countries of Scandinavia, while the lowest levels of trust tend to be found in South America, Africa and parts of Asia. In these multi-national comparative surveys, the U.S. population ranks in the upper middle range of trust.3
Why Do We Trust?
Within the United States, the demographic breakdowns described at the top of this report have been evident in surveys taken over many decades. Some seem fairly easy to explain, but others remain an ongoing source of mystification.
On the easier-to-explain front, the findings about the lower levels of trust among minorities and low income groups are in sync with a pattern that scholars have long observed – people who feel vulnerable or disadvantaged, for whatever reason, tend to find it riskier to trust because they’re less well-fortified to deal with the consequences of misplaced trust.4 In line with this formulation, the Pew survey also finds that college graduates are more trusting than those with less education; and that professionals are more trusting than those in the working class.
Where Do We Trust?
It is more difficult to untangle the relationship between where people live and how much they trust. Why exactly is it that urbanites are less trusting than their country cousins? One obvious explanation is that more poor people and minorities live in cities – and these two groups are among the least trusting segments of society. But even after we controlled for these factors (through a statistical technique known as regression analysis), we still found that city folks are less trusting than people who live in suburbs, small towns or rural areas.5
Might physical proximity be a factor? Is it possible that people are less inclined to trust other people the more often they have to rub elbows with them? An analysis of the Pew survey data does indeed find a slight tendency for levels of social trust to fall as population density (analyzed on a county-by-county basis) rises. The survey also finds that people who describe where they live as a rural area are the most trusting; people who say they live in a large city are the least trusting; and those who say they live in a suburb or a small towns fall somewhere in between. But it’s by no means clear that there is any causal connection in any of this.
In fact, many social trust theorists posit that the more connections that people have with other people, the more trusting they are likely to be. This explanation lines up nicely with American lore. Our nation has always sung the praises of the tight-knit communities of rural and small town America, just as it has tended to depict life in the suburbs as isolated and rootless.
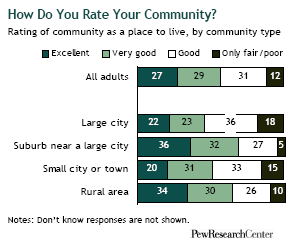
The Pew survey asked no questions about social interactions per se, so it can offer no enlightenment about that hypothesis. It does find that – whether or not they are trusting – suburbanites and rural residents give higher marks to their communities as places to live, while residents of cities and small towns give their communities lower marks.
In short, the community type findings are a bit of a puzzle. When it comes to social trust, it’s true that there’s a significant difference between living in the city and the country – it’s just not entirely clear why.
At What Age Do We Trust?
As with community type and trust, the relationship between age and trust follows a clear pattern but serves up a Rubik’s cube of potential explanations.
The finding from the Pew survey is in line with similar surveys taken through the years: younger adults are less trusting than are those who are middle aged or older. But why?
It could be a life cycle effect – as people pile up more experiences and have more interactions with others, they become more trusting. Or it could be a generational effect – today’s older adults may have come of age at a time when social mores and historical events provided a more fertile seed bed for social trust.6
The generational cohort theory was popularized in the 1990s by political scientist Robert Putnam, who posited that people born before 1930 are more trusting and civic-minded as a result of their big coming-of-age experience (World War II), while successive generations are less trusting as a result of theirs (take your pick: Vietnam, Watergate, the coarsening of the popular culture, television, suburbanization).
When it was first advanced a decade ago, Putnam’s theory proved to be a lightning rod for both praise and criticism. In recent years, analyses by other scholars have found that there is both a life cycle and a cohort explanation for the way that social trust is higher among the middle-aged and elderly in this country than among the young.7
Other Groups that Have a Distinctive Take on Trust
In addition to the demographic groups highlighted at the start of this report, there are other segments of the population in which significant differences emerge on the question of trust. Among them:
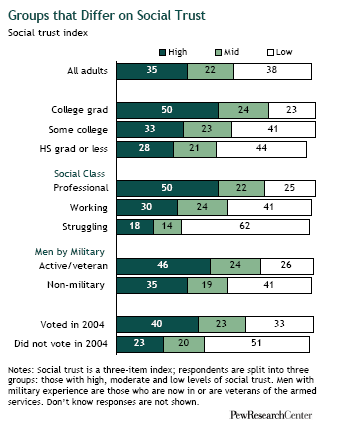
Education: Some 50% of college graduates have high levels of social trust, compared with 28% of those with a high school education or less.
Social/economic class: Some 50% of those who describe their household as professional or business class have high levels of social trust, compared with 30% of those who describe themselves as working class and 18% among those who describe themselves as the struggling class.
Military experience: Some 46% of men with military experience (either as veterans or currently in the armed services) have high levels of social trust, compared with 35% among men who have never served in the military.
Voting history: People who voted in the last presidential election are nearly twice as likely as people who didn’t vote (40% compared with 23%) to have a high level of social trust.
Group Traits that Matter Just a Little – or Not at All
There are other group characteristics that have either little or no bearing on trust. For example, men are more inclined than women to have a high level of social trust, but the variance is fairly small – 38% for men, compared with 32% for women.
Southerners tend to be a bit less trusting than residents of the West, Midwest or Northeast – a difference partly explained by the higher percentage of blacks who live in the South.
Republicans (42%) are more likely than Democrats (34%) to have a high level of social trust, but these partisan differences are not statistically significant once income is controlled. And there are virtually no differences in social trust by ideology – with conservatives, liberals and moderates all at very similar levels.
Finally, there’s virtually no difference between Protestants and Catholics in levels of social trust. Nor are there any differences among Protestants and Catholics and people who have no religious preference.
About the Survey
Results for this survey are based on telephone interviews conducted with a nationally representative sample of adults, ages 18 years and older, living in continental U.S. telephone households.
- Interviews conducted Oct. 18-Nov. 9, 2006
- 2,000 interviews
- Margin of sampling error is plus or minus 2.5 percentage points for results based on the total sample at the 95% confidence level. The margin of sampling error is higher for results based on subgroups of respondents.
Survey interviews conducted under the direction of Princeton Survey Research Associates International. Interviews were conducted in English and Spanish.
Bear in mind that question wording and practical difficulties in conducting surveys can introduce error or bias in the finds of opinion polls.
Read the full report for more details.


