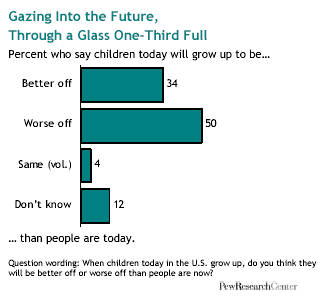
The idea that each generation of children will grow up to be better off than the one that preceded it has always been a part of the American dream. But barely a third of adults expect things to work out that way for today’s children, according to a new Pew Research Center survey.

About half of adults (50%) say that today’s children will grow up to be worse off than people are now. A third (34%) say they’ll be better off and most of the rest say they aren’t sure.
The only major racial or ethnic group which doesn’t buy into this pessimistic view of the next generation’s future is one that has been much in the news lately – Hispanics. Even though Latino adults are less satisfied than whites and blacks are about the quality of their own lives today, they’re more optimistic than both other groups about the future of American children.
The downbeat assessment that much of the country shares about the future of today’s children is by no means unprecedented. A dozen years ago people had roughly the same negative view that they have now. But as the economy boomed in the 1990s, America’s faith in the future rose with it. By 1999, a majority (55%) believed that children would grow up to be better off than their parents, while just over a third (36%) said they would be worse off.1
Then came the attacks of September 11, 2001 – and the onset of a new mood of wariness about the future. In 2002, only about four-in-ten (41%) said they expected today’s children to be better off when they grow up than people are today. And now, that number has dropped still further – to 34%, about where it was in 1994.
The question in the Pew survey – “When children today in the U.S. grow up, do you think they will be better off or worse off than people are now?” – was posed to a nationally representative sample of 2,250 randomly selected adults in a telephone survey conducted from Feb. 8 through March 7, 2006. The question doesn’t define what “better off” or “worse off” mean; this is left for respondents to determine for themselves.
It bears noting that the question wording refers to “children in the U.S.” and not to “your own children.” Other surveys taken through the years have found respondents to be more optimistic about their own children’s future than they are about the future of American children in general.2
The Old Are More Downbeat than the Young

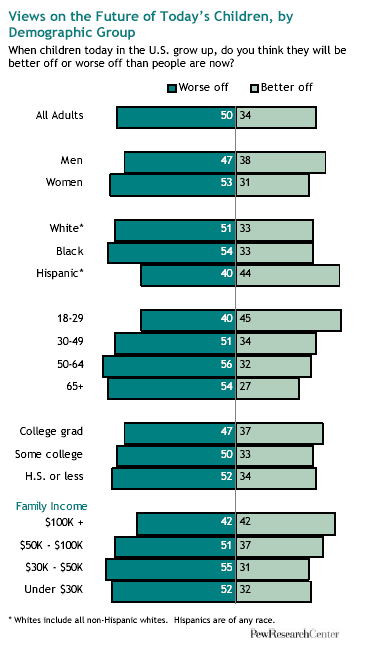
Now as in 2002, older Americans have the least faith in the future of today’s children. By a two-to-one margin, people ages 65 and over say today’s children will be worse off when they grow up than people are now. By contrast, a slight plurality (45%) of 18-to-29 year olds say kids today will grow up better off, while 40% of people in this age group say they will be worse off. (Looking at even younger age groups, a 2005 Gallup survey of teenagers found even more optimism. By a margin of nearly three-to-one, teenagers are optimistic rather than pessimistic about the world that their own children will one day live in, the Gallup survey found.)3
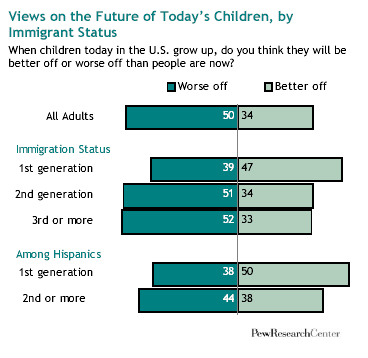
As for other groupings in the 2006 Pew survey, women are more pessimistic than men about the future of today’s young; the low-income are more pessimistic than the well-to-do; Democrats are more pessimistic than Republicans; and those whose families have been in this country two generations or more are more pessimistic than immigrants.
One group which has registered an especially sharp decline in optimism over the past four years has been the college educated (“better off” down 14 percentage points since 2002; “worse off” up 9 percentage points). Other declines have occurred among the middle-aged and the middle-income.
One of the more reliable predictors of whether someone is downbeat or upbeat about the next generation’s future has to do with how that person rates his or her life right now. Those who say the quality of their own life is fair or poor are more likely to be downbeat about the future prospects of today’s young than are those who rate their own life as good or excellent.
The Hispanic Exception

Hispanics are the only major racial or ethnic group in the country that tilts toward optimism about the future of today’s children. Some 44% of Hispanics say that today’s children will grow up to be better off than people are now, while 40% say today’s children will be worse off.
By contrast, half of all non-Hispanic whites say things will be worse for today’s children when they grow up, while just a third (33%) says things will be better. Blacks are even more pessimistic: 54% say things will be worse and just 33% say things will be better. (There were not enough Asian-American or other ethnic/racial group respondents in the sample to permit meaningful assessments of their views on this question).
The relative optimism of Hispanics about the future of U.S. children is especially notable because Hispanics register less overall satisfaction with the quality of their own lives today (64% say it’s good or excellent) than do either non-Hispanic whites (86% good or excellent) or blacks (76% good or excellent). Still, they’re more optimistic about the next generation’s prospects.
One likely explanation is that so many Hispanics are immigrants – and immigrants throughout history have tended to be upwardly mobile people with faith in the future. In the 2006 Pew survey, half of all first-generation Hispanics say that today’s children in the United States will be better off than people are now, while 38% of second- and later-generation Hispanics say that.
In a separate 2002 survey of Latinos by the Pew Hispanic Center, respondents were extremely upbeat about the upward mobility of Hispanic children in this country. More than three-quarters of all Hispanics in that survey said they were confident that Hispanic children would get a better education (80%) and better-paying jobs (76%) than they themselves have now.4
Attitudes about Generational Upward Mobility: The Trend Lines

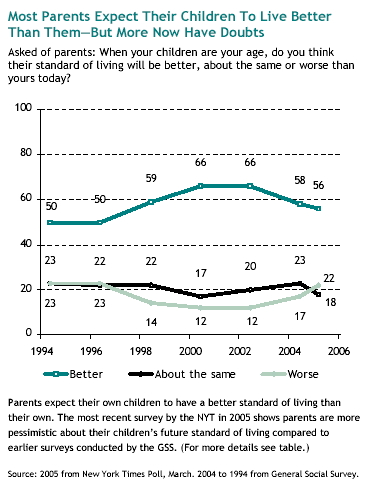
Since 1994, the General Social Survey (GSS), conducted by the National Opinion Research Center at the University of Chicago, has asked respondents every few years to compare their own standard of living with that of their parents when they were the same age – and also with what they think their children’s will be when they grow up to be the same age. Last year, a New York Times poll also asked those questions.5
These are not quite the same questions as the one posed by Pew. Those surveys focus specifically on standard of living, and ask about one’s own children and parents, rather than about all children and parents. Nonetheless they shed light on the same general topic of changing attitudes about generational upward mobility.
The GSS and New York Times surveys show that respondents by heavy margins believe that they have done better than their own parents, and by strong but not quite as lopsided margins believe that their own children will grow up to do better than they’ve done. Keep in mind that people tend to be more upbeat when asked about their own children’s future than when asked about the future of children in general. And also note that, in the GSS and New York Times trend line, optimism about one’s own children’s future was higher in the late 1990s (coinciding with a rising economy), but has since fallen back a bit.
The future, in short, looks a bit less rosy than it did at its peak for many American families. There could be many reasons – worries about terrorism, personal security, moral values, standard of living, what have you. Since 2002, satisfaction with the overall state of the country has also declined.6 So in America circa 2006, there is declining contentment with the present and growing pessimism about the future.
About the Survey
Results for this survey are based on telephone interviews conducted with a nationally representative sample of adults, ages 18 years and older, living in continental U.S. telephone households.
- Interviews conducted February 8-March 7, 2006
- 2,250 interviews
- Margin of sampling error is plus or minus 2.5 percentage points for results based on the total sample at the 95% confidence level. The margin of sampling error is higher for results based on subgroups of respondents.
Survey interviews conducted under the direction of Princeton Survey Research Associates International. Interviews were conducted in English and Spanish.
In addition to sampling error, bear in mind that question wording and practical difficulties in conducting surveys can introduce error or bias in the findings of opinion polls.
Read the full report for more details.


