I. Overview
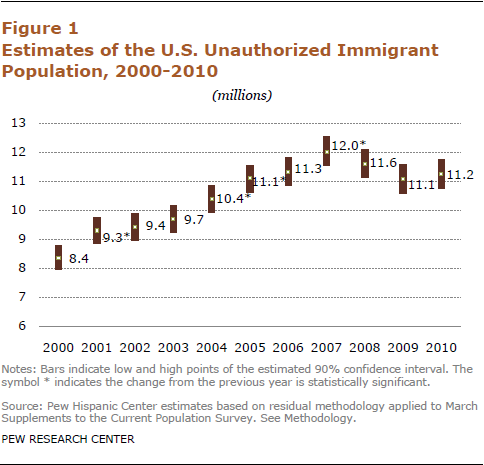
As of March 2010, 11.2 million unauthorized immigrants were living in the United States, virtually unchanged from a year earlier, according to new estimates from the Pew Hispanic Center, a project of the Pew Research Center. This stability in 2010 follows a two-year decline from the peak of 12 million in 2007 to 11.1 million in 2009 that was the first significant reversal in a two-decade pattern of growth.

The number of unauthorized immigrants in the nation’s workforce, 8 million in March 2010, also did not differ from the Pew Hispanic Center estimate for 2009. As with the population total, the number of unauthorized immigrants in the labor force had decreased in 2009 from its peak of 8.4 million in 2007. They made up 5.2% of the labor force in 2010.
The number of children born to at least one unauthorized-immigrant parent in 2009 was 350,000 and they made up 8% of all U.S. births, essentially the same as a year earlier. An analysis of the year of entry of unauthorized immigrants who became parents in 2009 indicates that 61% arrived in the U.S. before 2004, 30% arrived from 2004 to 2007, and 9% arrived from 2008 to 2010.
According to the Pew Hispanic Center, unauthorized immigrants made up 3.7% of the nation’s population and 5.2% of its labor force in March 2010. Births to unauthorized immigrant parents accounted for 8% of newborns from March 2009 to March 2010, according to the center’s estimates, which are based mainly on data from the government’s Current Population Survey.
The decline in the population of unauthorized immigrants from its peak in 2007 appears due mainly to a decrease in the number from Mexico, which went down to 6.5 million in 2010 from 7 million in 2007. Mexicans remain the largest group of unauthorized immigrants, accounting for 58% of the total.

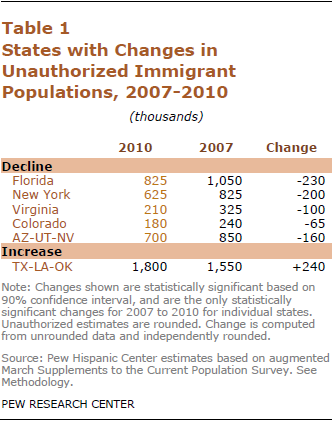
The decline in the population of unauthorized immigrants since 2007 has been especially marked in some states that recently had attracted large numbers of unauthorized immigrants. The number has decreased in Colorado, Florida, New York and Virginia. The combined unauthorized immigrant population of three contiguous Mountain West states—Arizona, Nevada and Utah—also declined.
The number of unauthorized immigrants may have declined in other states as well, but this cannot be stated conclusively because the measured change was within the margin of error for these estimates.
In contrast to the national trend, the number of unauthorized immigrants has grown in some West South Central states. From 2007 to 2010, there was a statistically significant increase in the combined unauthorized immigrant population of Louisiana, Oklahoma and Texas. The change was not statistically significant for these states individually, but it was for the combined three states. Texas has the second largest number of unauthorized immigrants, trailing only California.
Despite the recent decline and leveling off, the number of unauthorized immigrants living in the United States has tripled since 1990, when it was 3.5 million. The size of this population grew by a third since 2000, when was 8.4 million.
The estimates are produced using a multistage method that subtracts the legal foreign-born population from the total adjusted foreign-born population, with the residual then used as the source of information about unauthorized immigrants. The source of these data is the U.S. Census Bureau’s March Current Population Surveys.
Because these estimates are derived from sample surveys, they are subject to uncertainty from sampling error, as well as other types of error. Each annual estimate of the unauthorized population is actually the middle point of a range of possible values that could be the true number. Additionally, the change from one year to the next has its own margin of error.
Because of the margin of error in these estimates, two numbers may look different but cannot be said definitively to be different. For example, there is no statistically significant difference between the estimate of the unauthorized population for 2009 (11.1 million) and the estimate for 2010 (11.2 million). Similarly, some state estimates for single years are based on small samples; especially in less populous states, two single years should not be compared.
These ranges represent 90% confidence intervals, meaning that there is a 90% probability that the range contains the true value.
Although the estimates presented here indicate trends in the size and composition of the unauthorized-immigrant population, they are not designed to answer the question of why these changes occurred. There are many possible factors. The deep recession that began in the U.S. economy in late 2007 officially ended in 2009, but recovery has been slow to take hold and unemployment remains high. Immigration flows have tended to decrease in previous periods of economic distress.
The period covered by this analysis also has been accompanied by changes in the level of immigration enforcement and in enforcement strategies, not only by the federal government but also at state and local levels. Immigration also is subject to pressure by demographic and economic conditions in sending countries. This analysis does not attempt to quantify the relative impact of these forces on levels of unauthorized immigration.
About this Report
This report estimates the size of the unauthorized immigrant population, as well as the unauthorized immigrant labor force for the nation and each state in March 2010. For the nation, it also describes this population by region or country of birth and arrival period. For some of these variables, the report provides annual trends from 2000 onward. Updating and expanding on an earlier report about U.S.-born children of unauthorized immigrants, the report provides estimates and trends for the status of children of unauthorized immigrants as well as information about their parents’ period of arrival and country of origin.
The Pew Hispanic Center estimates the unauthorized immigrant population using the “residual method,” a well-developed and widely accepted technique that is based on official government data. Under this methodology, a demographic estimate of the legal foreign-born population—naturalized citizens, legal permanent residents, temporary legal residents and refugees—is subtracted from the total foreign-born population. The remainder, or residual, is the source of population estimates and characteristics of unauthorized immigrants.
These Pew Hispanic Center estimates use data mainly from the Current Population Survey (CPS), a monthly survey of about 55,000 households conducted jointly by the U.S. Bureau of Labor Statistics and the Census Bureau. It is best known as the source for monthly unemployment statistics. Each March, the CPS sample size and questionnaire are expanded to produce additional data on the foreign-born population and other topics. The Pew Hispanic Center estimates make adjustments to the government data to compensate for undercounting of some groups, and therefore its population totals differ somewhat from the ones the government uses. Estimates for any given year are based on a March reference date.
Because of small sample size in many states and potentially large sampling variability, some state estimates presented are based on multiyear averages. For the 34 states with fewer than 50 cases of unauthorized immigrant households in the 2010 sample survey, the estimates for that year are an average of 2009 and 2010. These states are Alabama, Alaska, Arkansas, Delaware, Hawaii, Idaho, Indiana, Iowa, Kansas, Kentucky, Louisiana, Maine, Massachusetts, Michigan, Minnesota, Mississippi, Missouri, Montana, Nebraska, New Hampshire, New Mexico, North Dakota, Ohio, Oklahoma, Pennsylvania, Rhode Island, South Carolina, South Dakota, Tennessee, Utah, Vermont, West Virginia, Wisconsin and Wyoming. Estimates for other states and for the District of Columbia are based solely on 2010 data.
All 2007 state estimates were derived by calculating the average share of the national unauthorized immigrant population for 2006-2008 that was held by each state, then applying that share to the 2007 national total.
For more detail, see the Methodology appendix.
A Note on Terminology
“Foreign born” refers to an individual who is not a U.S. citizen at birth or, in other words, who is born outside the U.S., Puerto Rico or other U.S. territories and whose parents are not U.S. citizens. The terms “foreign born” and “immigrant” are used interchangeably.
“U.S. born” refers to an individual who is a U.S. citizen at birth, including people born in the United States, Puerto Rico or other U.S. territories, as well as those born elsewhere to parents who are U.S. citizens.
The “legal immigrant” population is defined as people granted legal permanent residence; those granted asylum; people admitted as refugees; and people admitted under a set of specific authorized temporary statuses for longer-term residence and work. This group includes “naturalized citizens,” legal immigrants who have become U.S. citizens through naturalization; “legal permanent resident aliens,” who have been granted permission to stay indefinitely in the U.S. as permanent residents, asylees or refugees; and “legal temporary migrants,” who are allowed to live and, in some cases, work in the U.S. for specific periods of time (usually longer than one year).
“Unauthorized immigrants” are all foreign-born non-citizens residing in the country who are not “legal immigrants.” These definitions reflect standard and customary usage by the Department of Homeland Security and academic researchers. The vast majority of unauthorized immigrants entered the country without valid documents or arrived with valid visas but stayed past their visa expiration date or otherwise violated the terms of their admission. Some who entered as unauthorized immigrants or violated terms of admission have obtained work authorization by applying for adjustment to legal permanent status or by obtaining Temporary Protected Status (TPS). Data are very limited, but this “quasi-legal” group could account for as much as 10% of the unauthorized population. Many could also revert to unauthorized status.
“Children” are people under age 18 who are not married. “Adults” are ages 18 and older.
“Children of unauthorized immigrants” or “children of unauthorized immigrant parents” include both foreign-born and U.S.-born children who live with at least one unauthorized immigrant parent.
About the Authors
Jeffrey S. Passel is a senior demographer at the Pew Hispanic Center. He is a nationally known expert on immigration to the United States and on the demography of racial and ethnic groups. In 2005, Dr. Passel was made a fellow of the American Statistical Association, which cited his outstanding contributions to the measurement of population composition and change. He formerly served as principal research associate at the Urban Institute’s Labor, Human Services and Population Center. From 1987 to 1989, he was assistant chief for population estimates and projections in the Population Division of the U.S. Census Bureau.
D’Vera Cohn is a senior writer at the Pew Research Center. From 1985 to 2006, she was a reporter at The Washington Post, where she wrote chiefly about demographic trends and immigration. She was the newspaper’s lead reporter for the 2000 Census.
Acknowledgments
Paul Taylor provided editorial guidance in the drafting of this report. Daniel Dockterman and Gabriel Velasco prepared the charts and tables for this report; Daniel Dockterman checked its charts, tables and maps. Michael Keegan prepared the maps for this report. Marcia Kramer served as copy editor.


