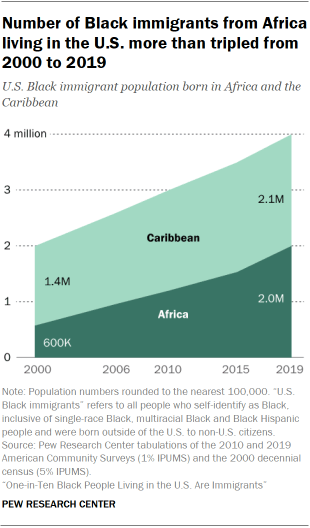
The vast majority of Black immigrants are from two regions: the Caribbean and Africa. These two areas accounted for 88% of all Black foreign-born people in the United States in 2019.
Black immigrants from Africa have been the primary driver for much of the overall recent growth in the Black immigrant population. Between 2000 and 2019, the Black African immigrant population grew 246%, from roughly 600,000 to 2.0 million. As a result, people of African origin now make up 42% of the overall foreign-born Black population, a substantial increase from 2000 when that share was 23%.
Still, the Caribbean remains the most common region of birth for Black immigrants. Just under half of the foreign-born Black population were born in this region (46%). Jamaica and Haiti are the two largest origin countries, accounting for 16% and 15% of Black immigrants, respectively.
Beyond Africa and the Caribbean, about one-in-ten Black immigrants (8%) were born in South America, Central America, or Mexico, while relatively small shares are from Europe (2%) or Asia (1%).
A brief history of Black immigration to the U.S.
The trans-Atlantic slave trade marked the beginning of the Black population in the U.S., with the first record of an enslaved African person in the U.S. in 1619. The importation of enslaved African people persisted until 1808, when this practice was outlawed. By 1810, there was already a significant U.S. Black population (19% of the overall population, according to the 1810 decennial census). Restrictive immigration policies on non-Western Europeans after the U.S. Civil War slowed the voluntary migration of Black people to the U.S. until the mid-20th century.
The most recent wave of voluntary Black immigration – as well as the arrival of immigrants from Latin America, Asia and the Middle East – is mostly due to changing immigration policies over the 20th century, such as the Immigration and Nationality Act of 1965. The 1965 act marked a departure from the United States’ previous long-standing national origins quota system (which restricted the ability of immigrants from outside Western Europe to move to the U.S.) to a new system that emphasized family reunification and skilled immigrants. Black immigration to the U.S. would later be expanded further with the Refugee Act of 1980.
The 1980 act both created a definition for refugees and created a system for refugee admissions. This act also allowed for the refugee ceiling to be amended in emergency situations, such as the large influx of the refugee situation created by the Vietnam War in the late 1970s. The act also paved the way for refugees from countries such as the Democratic Republic of the Congo, Eritrea and Ethiopia to come to the U.S. in more recent years. A decade later, the Immigration Act of 1990 created the Diversity Immigrant Visa Program to encourage immigration from countries that did not send many people to the U.S. The Diversity Immigrant Visa program increased the number of immigrants from Sudan, Ethiopia and Kenya, among other countries.
Jamaica and Haiti remain top countries of origin for Black immigrants
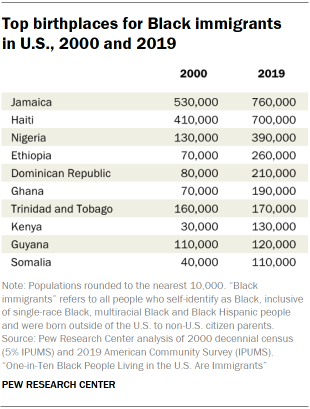
The top 10 countries of origin accounted for 69% of the foreign-born Black population in 2000 and 66% in 2019. All of these countries are in Africa or the Caribbean.
Though there have been some shifts in the top countries of origin for Black immigrants to the U.S., Jamaica and Haiti have been the top two countries, respectively, in both 2000 and 2019. In 2000, those two Caribbean nations accounted for almost four-in-ten (39%) Black immigrants, but in 2019, their collective share had decreased to 31%, indicating a greater diversity of Black immigrants to the U.S. Nigeria and Ethiopia were the top birthplaces for Black African immigrants to the U.S. in 2019, with roughly 390,000 and 260,000 immigrants, respectively.
Some countries of origin have seen large increases since 2000. Kenya has seen the largest increase, with 348% growth, and there has been an almost 300% increase in the number of Ethiopian-born immigrants from 2000 to 2019. The Somali-born population in the U.S. has seen a 205% increase in the population of immigrants to the U.S., while the number of Black immigrants from Nigeria and Ghana have grown almost 200%. There have been similar increases in the number of Black immigrants from the Dominican Republic (144%). Jamaica and Haiti have seen more modest increases, with 42% and 68% increases respectively since 2000.
The legal status of Black immigrants
Black immigrants more likely than immigrants overall to be naturalized U.S. citizens
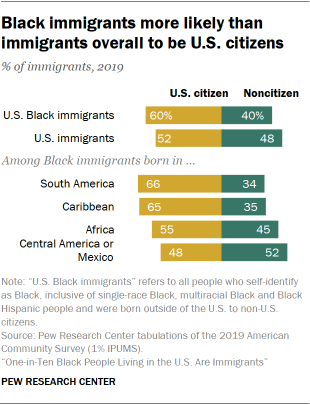
The Black foreign-born population differs from the nation’s overall immigrant population on several measures, including the share that gained U.S. citizenship through naturalization. A majority of the Black foreign-born population are naturalized U.S. citizens, which is slightly higher than that of all U.S. immigrants (60% vs. 52%)1. Citizenship rates differ among Black immigrants, with South American- and Caribbean -born immigrants having the highest rates (66% and 65%, respectively). Just over half of African-born Black immigrants hold citizenship (55%), while close to half (48%) of Central American or Mexican-born Black immigrants hold U.S. citizenship.
Admissions to the U.S.2
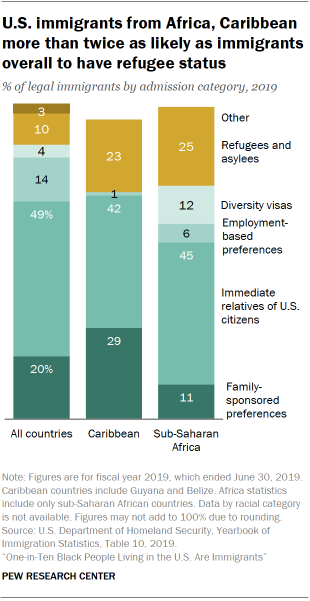
In fiscal year 2019, roughly 144,000 immigrants from the Caribbean and 92,000 from sub-Saharan Africa were admitted to the U.S., but the ways they entered or had their status adjusted varies by region. About one-quarter of sub-Saharan African and Caribbean legal immigrants in fiscal 2019 were admitted as refuges or asylees, compared with 10% of all immigrants. People from the Democratic Republic of the Congo made up the largest group of African-born people who were admitted entry to the U.S. as refugees or asylees that fiscal year, accounting for 24% of sub-Saharan Africa’s refugees and asylees in the U.S. Cuba made up the largest group of refugees and asylees admitted to the U.S. from the Caribbean, accounting for 98% of all Caribbean-born immigrants admitted as refugees or asylees in fiscal year 2019.
There are also substantial differences in admissions through the diversity visa program. While less than 5% of the fiscal 2019 foreign-born population in the U.S. was admitted through the program, this share is 12% among those from sub-Saharan Africa. The single largest source country among diversity visa admissions from Africa is the Democratic Republic of the Congo. Still, family sponsorship is the most common way for immigrants overall – including those from sub-Saharan Africa or the Caribbean – to enter the U.S. or to adjust their status. The Dominican Republic and Nigeria were the two largest sources of family-sponsored entry to the U.S. in fiscal year 2019.
The foreign-born Black population is less likely than U.S. immigrants overall to be in the country without authorization
Foreign-born Black people are less likely to be in the U.S. without authorization than other U.S. immigrants. There were 625,000 Black immigrants living in the U.S. without authorization in 2017, accounting for 14% of all Black immigrants, according to Pew Research Center estimates. By comparison, 23% of the nation’s nearly 45 million immigrants are unauthorized.
