How U.S. Public Opinion Has Changed in 20 Years of Our Surveys
When The Pew Charitable Trusts created Pew Research Center in 2004, we were surveying Americans using the established industry method at the time: calling people on their landline phones and hoping they’d answer. As the Center marks its 20th anniversary this year, survey methods have become more diverse, and we now conduct most of our interviews online.
Public opinion itself has also changed in major ways over the last 20 years, just as the country and world have. In this data essay, we’ll take a closer look at how Americans’ views and experiences have evolved on topics ranging from technology and politics to religion and social issues.
To mark Pew Research Center’s 20th anniversary, this data essay summarizes key shifts in public opinion and national demographics between 2004 and 2024. The essay is based on survey data from the Center and the U.S. Census Bureau. Links to these sources are available in the text. The links to the Center surveys include information about their field dates, sample sizes and other methodological details.
All references to Republicans and Democrats in this analysis include independents who lean toward each party. White, Black and Asian racial categories reflect people who identify as single-race and non-Hispanic. Hispanics are of any race.
The rise of the internet, smartphones and social media
The past two decades have witnessed the emergence of all sorts of technologies that let people interact with the world in new ways. For instance, 63% of U.S. adults used the internet in 2004, and 65% owned a cellphone (we weren’t yet asking about smartphones). Today, 95% of U.S. adults browse the internet, and 90% own a smartphone, according to our surveys.
Social media was just taking off in 2004, the year Mark Zuckerberg launched “The Facebook” (as it was known then) from his Harvard dorm room. Since then, Americans have widely adopted social media. These platforms have also become a key source of news for the U.S. public, even as concerns about misinformation and national security have grown.
Meanwhile, many traditional news organizations have struggled. In 2004, daily weekday newspaper circulation in the U.S. totaled around 55 million. By 2022, that had fallen to just under 21 million. Newspapers’ advertising dollars and employee counts have also decreased.
In this more fragmented news environment, Americans – particularly Republicans – have become less trusting of the information that comes from news organizations. On the whole, however, more people still say they trust information from news organizations than from social media.

Other emerging technologies
Some technological changes over the past 20 years haven’t been as widely adopted, and a few still sound like science fiction. For example, Elon Musk announced this year that his company Neuralink had implanted a computer chip in a living person’s brain. The chip is intended to allow people to use phones or computers simply by thinking about what they want to do on the devices – an idea that Americans are largely hesitant about.
Other innovations we’ve surveyed about that might have seemed far-fetched back in 2004 include driverless passenger vehicles, space tourism, AI chatbots like ChatGPT, and gene editing to reduce a baby’s risk of developing serious health conditions. Our research suggests that Americans are still getting introduced to and forming opinions of these technologies, so we’ll likely see public attitudes evolve on these and other innovations over the next 20 years.
Declining trust in national institutions
Around the Center’s founding in 2004, 36% of Americans said they trusted the federal government to do what is right just about always or most of the time. By April 2024, just 22% said the same.
This is part of a longer-term decline in trust. In 1964, 77% of Americans trusted the federal government to do the right thing all or most of the time. There have been a few periods of increased trust in the decades since, including shortly after the Sept. 11 terrorist attacks. But since 2008, fewer than 30% of Americans have said they trust the government to do the right thing all or most of the time.
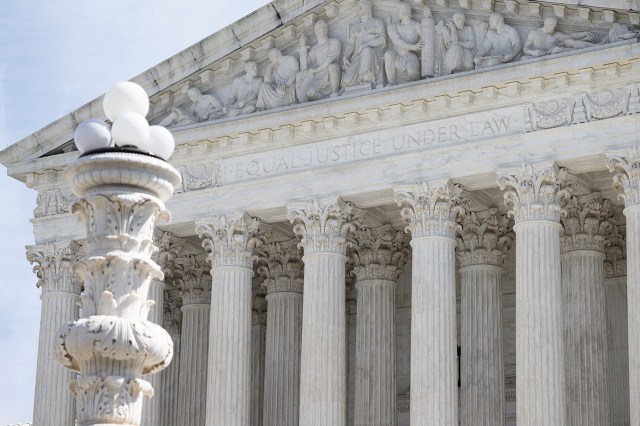
Views of Congress and the Supreme Court have also become more negative over the past 20 years. In 2006, 53% of Americans had a favorable view of Congress, but after some ups and downs, that share fell to 26% in 2023. And the share of adults who view the nation’s highest court favorably is near its lowest mark in almost 40 years of data.
The years during and after the coronavirus pandemic have also seen a more general distrust of people who were once considered experts. Many Americans were dissatisfied with the communication they received about the pandemic from public health officials, and close to half thought officials were unprepared for the initial coronavirus outbreak in the United States. Most Americans still trust scientists to act in the public’s best interest, but fewer say this now than in 2020, especially among Republicans.
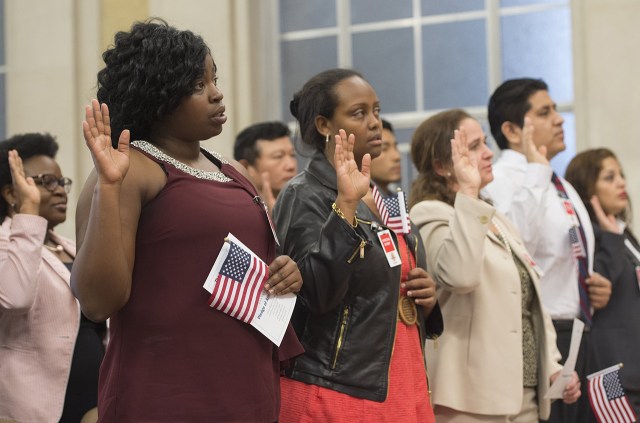
More diversity in the U.S. and its government
The U.S. has become much more diverse over the past 20 years on several measures, including immigrant status. Today, immigrants account for 13.8% of the nation’s population – near the record high from 1890 – and they have come from just about every country in the world.
Racial and ethnic diversity has also increased. Between 2004 and 2022, the U.S. population grew by 14%, according to the Census Bureau. But the Asian, Hispanic and Black populations all grew at faster rates – 74%, 55% and 22%, respectively – while the White population remained stable. As a result, the share of Americans who are White fell from 68% in 2004 to 59% in 2022.1
As the country has become more diverse, so have its voters – and its leaders. The 118th Congress is the most racially and ethnically diverse in history, and the number of women in Congress is at an all-time high. And majorities of President Joe Biden’s judicial appointments have been women and racial or ethnic minorities, a first for any president.
Still, there’s some skepticism that women will ever achieve parity with men in political leadership. In 2023, 52% of Americans said it is only a matter of time before there are as many women in political office as men, while 46% said men will continue to hold more high political offices.
Growing dissatisfaction with the Democratic and Republican parties
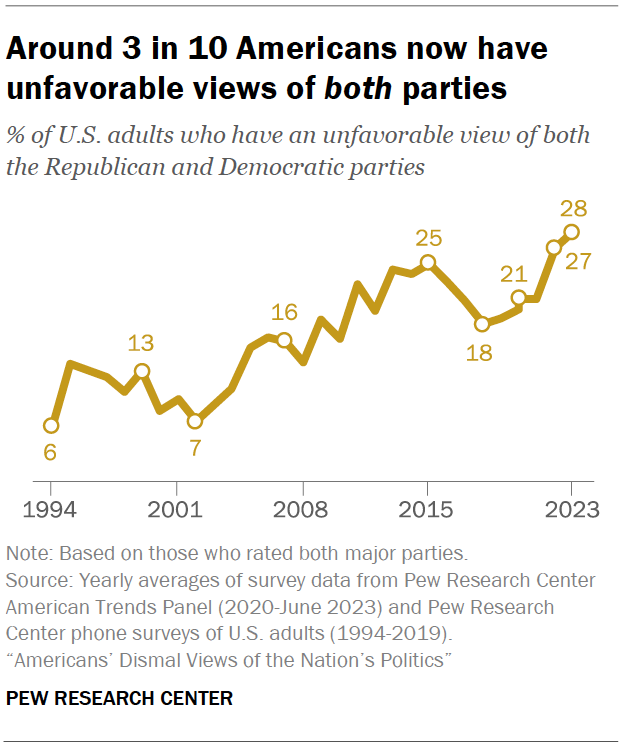
In the early 2000s, very few Americans had unfavorable views of both the Democratic and Republican parties. But over the next two decades, the share saying they dislike both major parties increased, reaching 28% in 2023.
This is just one element of Americans’ broad dissatisfaction with politics. As trust in political institutions declines, few Americans now think the political system is working even somewhat well. Majorities say that most elected officials don’t care what people like them think and that ordinary people have too little influence on Congress’ decision-making. And most see little or no common ground between Republicans and Democrats on the economy, the environment, the budget deficit, immigration, gun policy or abortion.
As a result, many Americans say they regularly feel angry or exhausted when they think about U.S. politics, and very few feel hopeful and excited. When asked for the one word or phrase they’d use to describe politics today, some of the most common answers are “divisive,” “corrupt” and “messy.”
China’s emergence as a perceived threat – and even an enemy
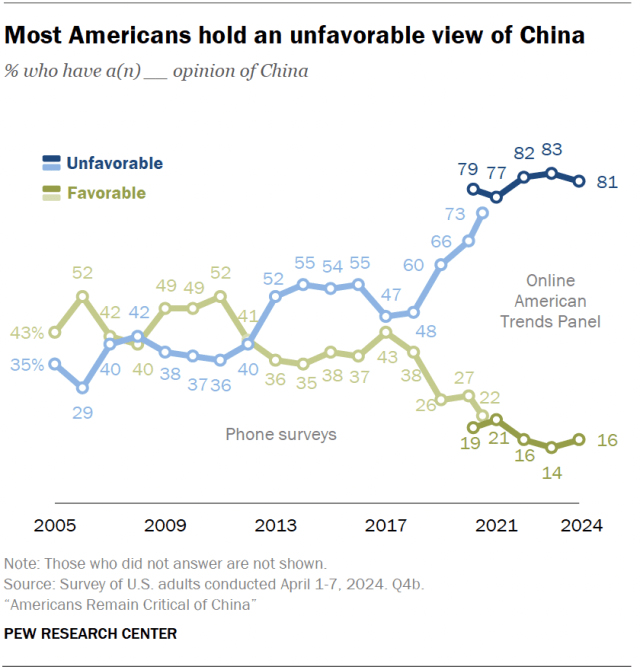
Americans’ views of China have become increasingly negative over the past two decades. In 2005, the first year we asked this question, 35% of U.S. adults had an unfavorable view of China. Today, about eight-in-ten view China unfavorably, and about four-in-ten say it is an enemy of the U.S., as opposed to a competitor or a partner.
In an open-ended survey question in 2023, half of Americans named China as the country that poses the greatest threat to the U.S. – about three times the share who named Russia, the second-most common answer. In contrast, China was only the third-most popular answer in 2007, behind Iran and Iraq.
The rise of the religiously unaffiliated
Many Americans describe themselves as atheist, agnostic or “nothing in particular.” At the Center, we refer to this group as religious “nones.”
The share of Americans who identify as religious nones is significantly higher than it was when we began asking this question about religious identity in 2007. In recent years, the share of religious nones has mostly been stable, around 28%. But it’s too early to tell whether this population is leveling off or will continue to grow.
Still, religious nones are currently one of the largest religious groups in the United States. They trail Protestants, who make up 41% of U.S. adults, but make up a larger share of the population than Catholics (20%) and all other faiths (8%).
While they don’t identify with any organized religion, many religious nones do hold some religious or spiritual beliefs. For example, most say there is some higher power or spiritual force in the universe, though just 13% say they believe in “God as described in the Bible.”
A reversal in public opinion about same-sex marriage
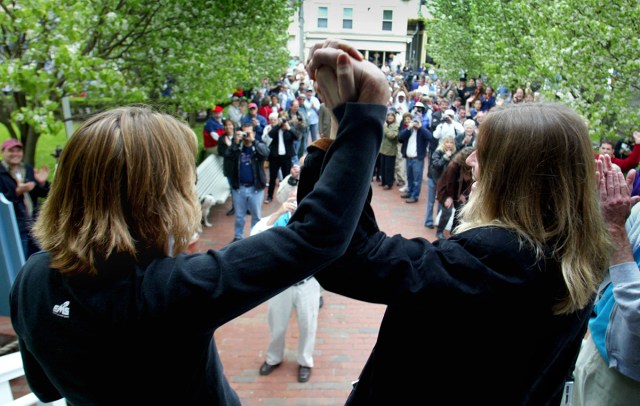
The first same-sex marriages in the U.S. took place in 2004 in Massachusetts – to the consternation of both presidential candidates at the time, Republican George W. Bush and Democrat John Kerry. Their opinions reflected those of the general public: That year, 31% of Americans supported same-sex marriage, while 60% opposed it.
By 2023, attitudes on same-sex marriage had effectively flipped: 63% of Americans supported it and 34% opposed it.
The tide began to turn around 2010, when similar shares expressed support and opposition for same-sex marriage. Soon, larger shares began to favor than oppose it. And by 2015, the U.S. Supreme Court issued its landmark Obergefell v. Hodges ruling, which established that same-sex couples have a constitutional right to marry.
Since the world’s first same-sex marriages were legally recognized in the Netherlands in 2001, many places globally have followed a similar path as the U.S. International views of same-sex marriage vary, but in general, there has been increased support over the past decade. Same-sex marriage is currently legal in more than 30 places worldwide, mostly in Europe and the Americas.
Another reversal: Marijuana legalization
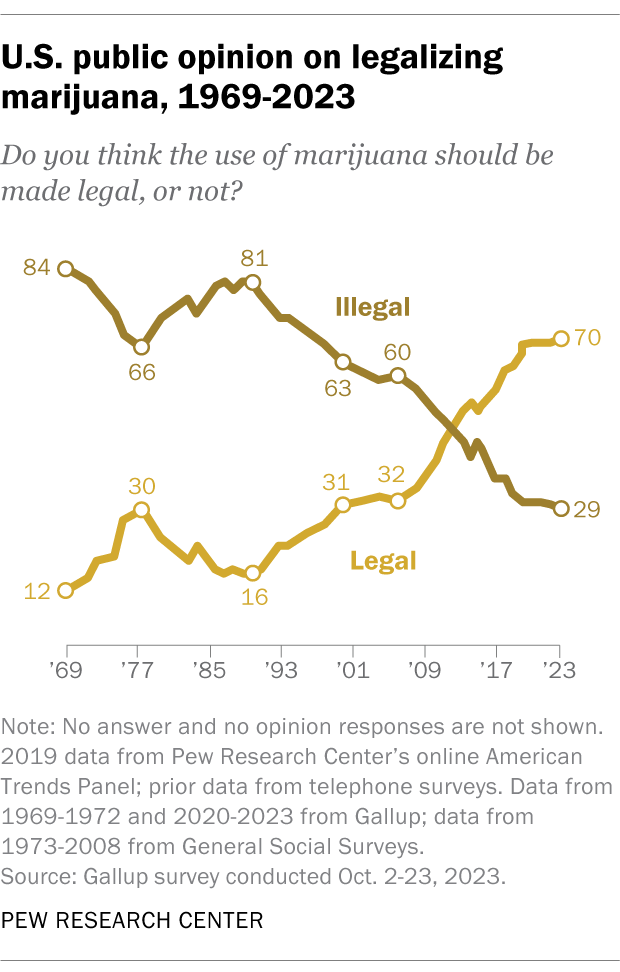
Support for legalizing marijuana has also been on the rise in the U.S. over the past two decades. Around the time the Center was established in 2004, just a third of U.S. adults said marijuana should be legalized, but that rose to 70% by 2023.
The change in attitudes is even starker when looking at the longer term. In 1969, just 12% of Americans supported legalizing marijuana. It wasn’t until 1996 that any state legalized the drug for medical purposes, and it took until 2012 for states to begin legalizing it for recreational purposes.
Today, 38 states and the District of Columbia have legalized marijuana for medical and/or recreational use.
Increasingly polarized views on climate change, guns, abortion
On several issues, the pattern is not just that Americans’ views have changed markedly over the past two decades. It’s that Democrats and Republicans have grown further apart in their views, eroding areas of common ground between the parties. (In this essay, as in most Center publications, “Democrats” and “Republicans” refer to people who identify with or lean toward that party.)
Consider climate change. In 2009, Democrats were already 36 percentage points more likely than Republicans to say climate change is a major threat to the U.S. (61% vs. 25%). But by 2022, that partisan gap had grown to 55 points: 78% of Democrats, but just 23% of Republicans, considered climate change a major threat.
Globally, people in many advanced economies tend to have similar levels of concern to U.S. Democrats. A median of 75% of adults across 19 countries we surveyed in 2022 said climate change is a major threat to their country.
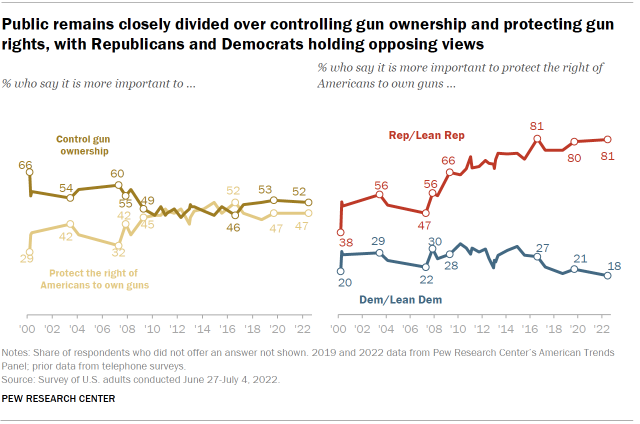
The topic of guns has become increasingly partisan, too. In 2003, 56% of Republicans and 29% of Democrats said it was more important to protect Americans’ right to own guns than to control gun ownership, a 27-point gap. But by 2022, that gap had swelled to 63 points (81% vs. 18%).
These changes coincided with major court rulings, including the Supreme Court’s 2008 decision in District of Columbia v. Heller, which held that the Second Amendment guarantees an individual’s right to have a gun.
Abortion is another subject where partisan divisions have grown. In 2007, 63% of Democrats said abortion should be legal in all or most cases. That share has grown to 85% today, following the Supreme Court’s 2022 decision to overturn Roe v. Wade, which had enshrined the constitutional right to abortion in 1973.
By comparison, there has been relatively little change in opinion among Republicans: About four-in-ten continue to say abortion should be legal in all or most cases. As a result, the partisan gap has soared from 24 points in 2007 to 44 points today.
Global views vary, but support for legal abortion has generally grown over the past decade in Europe, Latin America and India. A median of 66% of adults across 27 places we surveyed now say abortion should be legal in all or most cases. In most places where we can measure political ideology on a left-right scale, people on the left are more likely than those on the right to support legal abortion. But the U.S. has by far the largest gap between the two sides.
All photos by Getty Images