By their very nature, open-ended questions pose a greater cognitive challenge to respondents than closed-ended questions. As a result, answers to them also offer a more sensitive indicator of whether a respondent is sincere or not.
This study included six open-ended questions:
- How would you say you are feeling today?
- When you were growing up, what was the big city nearest where you lived?
- When you visit a new city, what kinds of activities do you like to do?
- How do you decide when your computer is too old and it’s time to purchase a new one?
- In retirement what skill would you most like to learn?
- What would you like to see elected leaders in Washington get done during the next few years? Please give as much detail as you can.
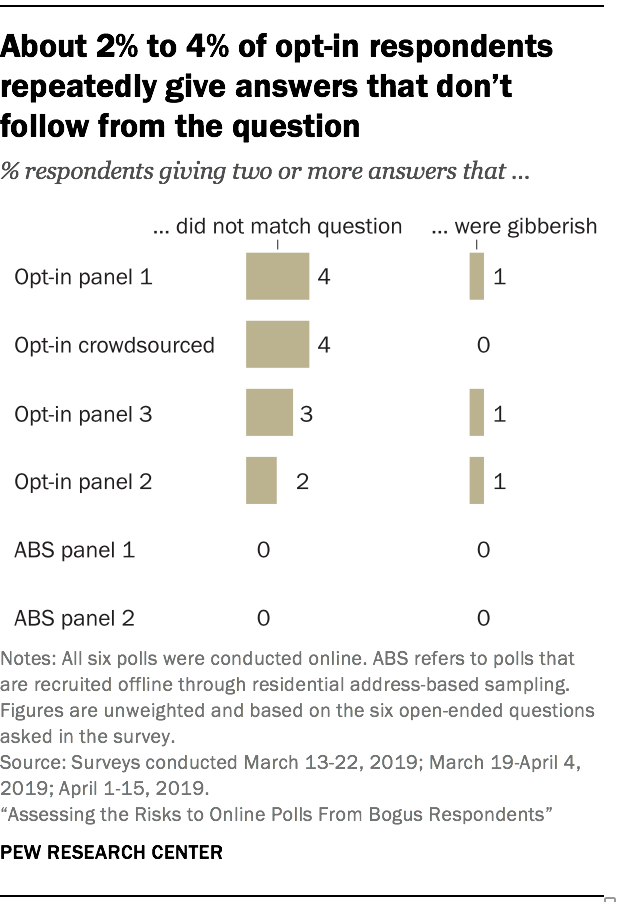
Researchers manually coded each of the 375,834 open-ended answers into one of four categories: responsive to the question; does not match the question; gibberish; or did not answer (respondent left it blank or gave a “don’t know” or refusal type answer).11 In all six sources most respondents appear to be giving genuine answers that are responsive to the question asked. That said, the study found that 2% to 4% of opt-in poll respondents repeatedly gave answers that did not match the question asked. Throughout the report we refer to such answers as non sequiturs. There were a few such respondents in the address-recruited panel samples, but as share of the total their incidence rounds to 0%.
Some non sequitur answers are more suspicious than others. For example, when asked “When you were growing up, what was the big city nearest where you lived?,” some respondents gave geographic answers like “Ohio” or “TN.” But others gave answers such as “ALL SERVICES SOUNDS VERY GOOD” or “content://media/external/file/738023”.12 Answering with a state when the question asked for a city is qualitatively different from answering with text that has absolutely no bearing on the question. This is among the reasons this report focuses on cases that gave multiple non sequiturs, as opposed to just one. Multiple instances of giving answers that do not match the question is a more reliable signal of a bogus interview than a single instance.
The study found that gibberish answers to open-ended questions were rare in both opt-in recruited and address-recruited online polls. The share of respondents giving multiple gibberish responses ranged from 0% to 1% depending on the sample. Examples of gibberish include “hgwyvbufhffbbibzbkjgfbgjjkbvjhj” and “Dffvdgggugcfhdggv Jr ffv. .” Certain letters, especially F, G, H, and J, were prominent in many gibberish answers. These letters are in the middle of QWERTY keyboards, making them particularly convenient for respondents haphazardly typing away. For a bot, by contrast, no letter requires more or less effort than another letter. This suggests that gibberish answers were probably given by humans who were satisficing (answering in a lazy manner) as opposed to bots.
There were differences across sources in the rates of not answering the open-ends, but that difference stems from administrative factors. The share giving a blank, “don’t know,” or refusal-type answer to two or more open-ended questions ranged from 13% to 19% for the address-recruited samples versus 1% to 2% for the opt-in samples. One reason for this is that people in the address-based panels are told explicitly that they do not have to answer every question. Each Pew Research Center survey begins with a screen that says, “You are not required to answer any question you do not wish to answer.” This is done to respect respondents’ sensibilities about content they may find off-putting for one reason or another. With public polls using opt-in panels, by contrast, it is common for answering questions to be required, though some pollsters permit not answering. In this study, opt-in survey panel respondents were not shown any special instructions and were required to answer each question. A follow-up data collection discussed in Chapter 8 allowed opt-in respondents to skip any question. When allowed to skip questions, 5% of opt-in survey panel respondents gave a blank, don’t know, or refusal type answer to two or more open-ended questions.
Non sequitur answers came in several forms
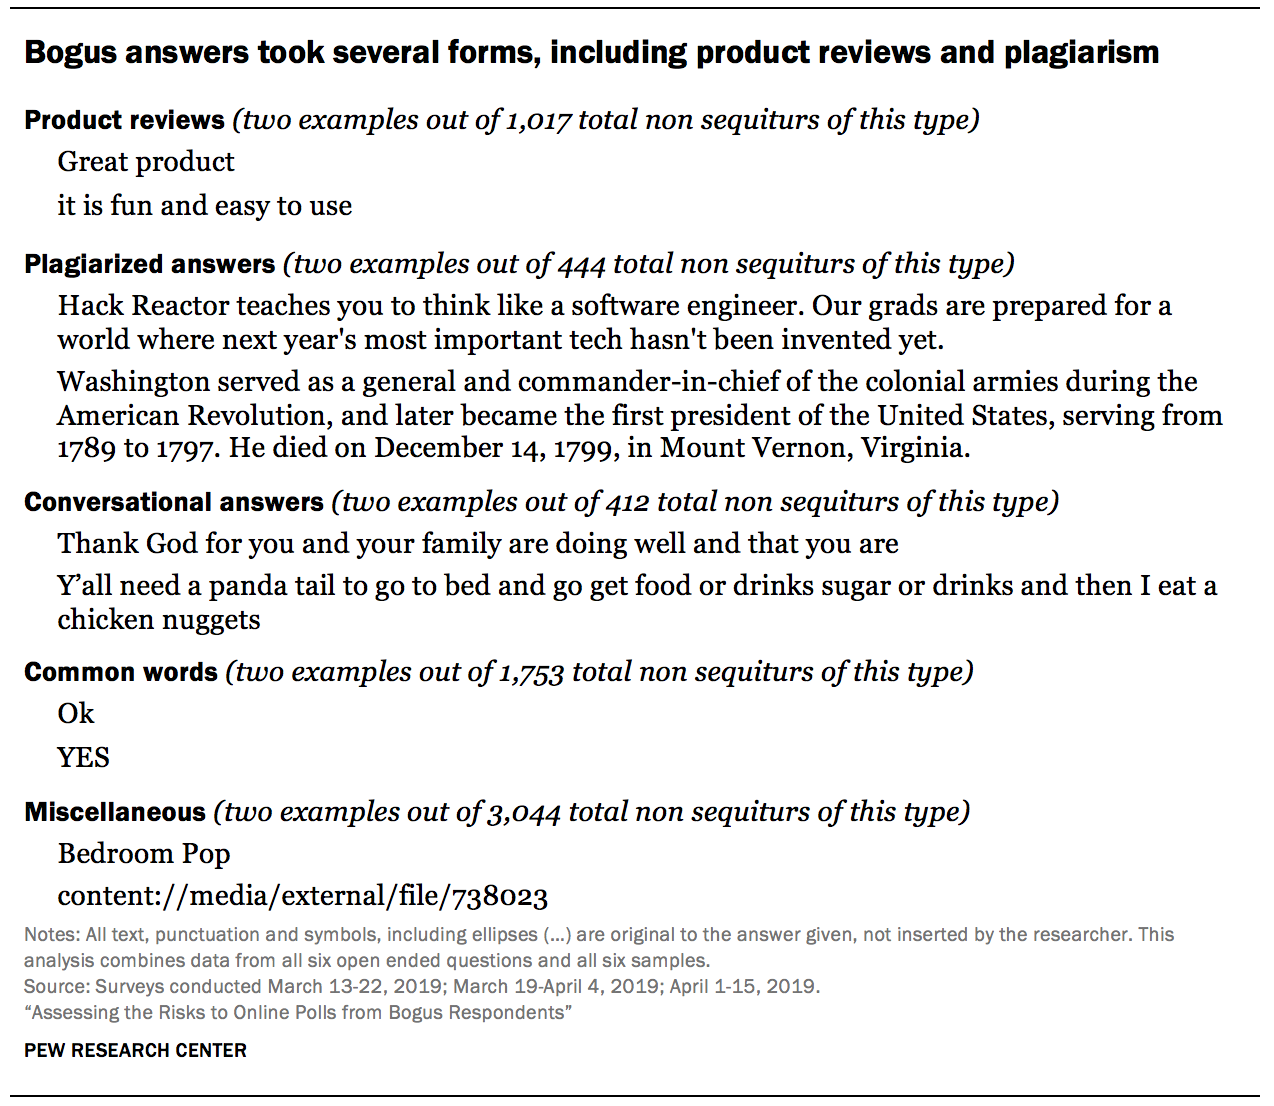
Examination of the 6,670 non sequitur answers revealed several different types: apparent product reviews, plagiarized text from other websites, conversational text, common words and miscellaneous non sequiturs.
Some respondents, particularly in the crowdsourced poll, gave plagiarized text
Some of the answers not only made no sense but were clearly lifted from elsewhere on the internet. Often these answers came from websites that are top hits when one enters the survey question into a search engine. For example, a Google search for “What would you like to see elected leaders in Washington get done during the next few years?,” returns a webpage on MountVernon.org, two articles on WashingtonPost.com, and one webpage for the Washington State Legislature. Opt-in respondents gave answers plagiarizing text from all four.
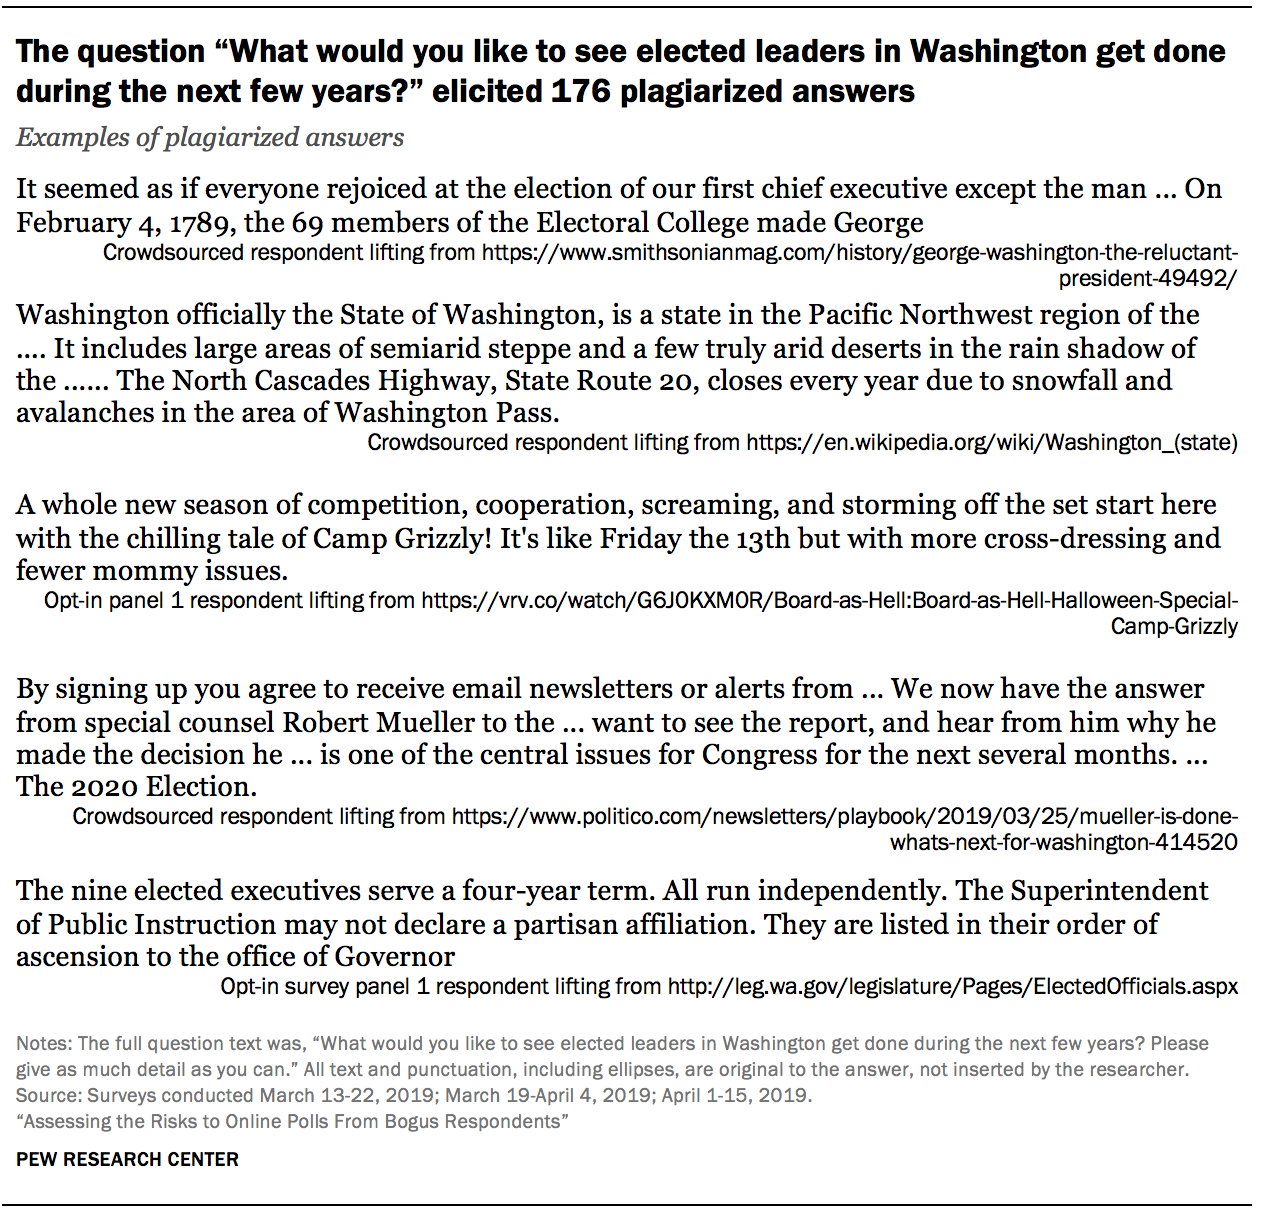
The study found 201 respondents plagiarizing from 125 different websites. Appendix D lists the source website for each plagiarized answer that was detected. While there were a few instances of this occurring in one of the opt-in survey panels, almost all of the respondents who gave plagiarized answers came from the crowdsourced sample (97%). No plagiarizing respondents were found in the address-recruited online polls. Some 194 respondents in the crowdsourced poll (2%) were found giving at least one plagiarized answer.
One explanation for the plagiarism is that some respondents were not interested in politics and searched for help crafting an acceptable answer. Even in this best case scenario it is very questionable that the respondents genuinely held the views expressed in their answers. Many other respondents answered openly that they do not follow or care about politics, without plagiarizing.
The charitable explanation of respondents just needing a little help crafting an answer falls apart when considering responses to “How would you say you are feeling today?” This is a simple question for which it is almost unimaginable that someone would bother to plagiarize an answer. In this study 35 respondents did so. They gave answers such as:
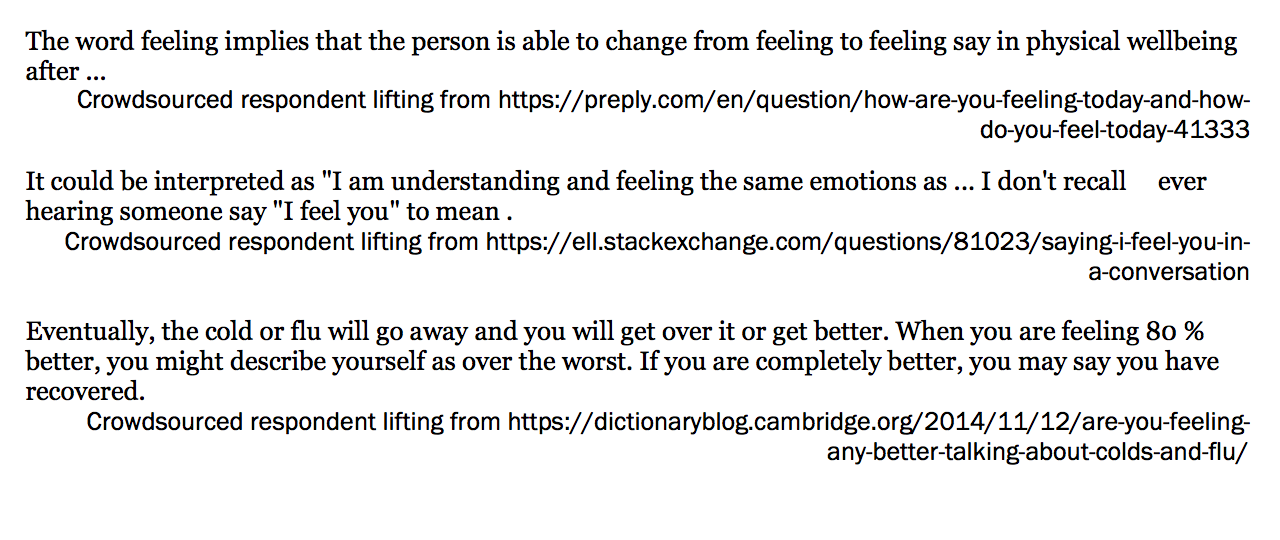
Many plagiarized responses were remarkably similar. Not only did they tend to pull from some of the same websites; they often lifted the exact same text. For example, when asked “When you visit a new city, what kinds of activities do you like to do?,” 15 respondents gave the same passage of text from an article in the travel section stltoday.com.
When researchers tracked plagiarized responses back to their source website, they found variance in where text was lifted. In some cases, the plagiarized text was at or very near the top of the webpage. In other cases, portions of text were lifted from the middle or bottom of a page. Among those plagiarizing, it was common for them to join different passages with an ellipsis (…). It seems likely that at least some of the ellipses come from the respondent copying directly from the search engine results page.
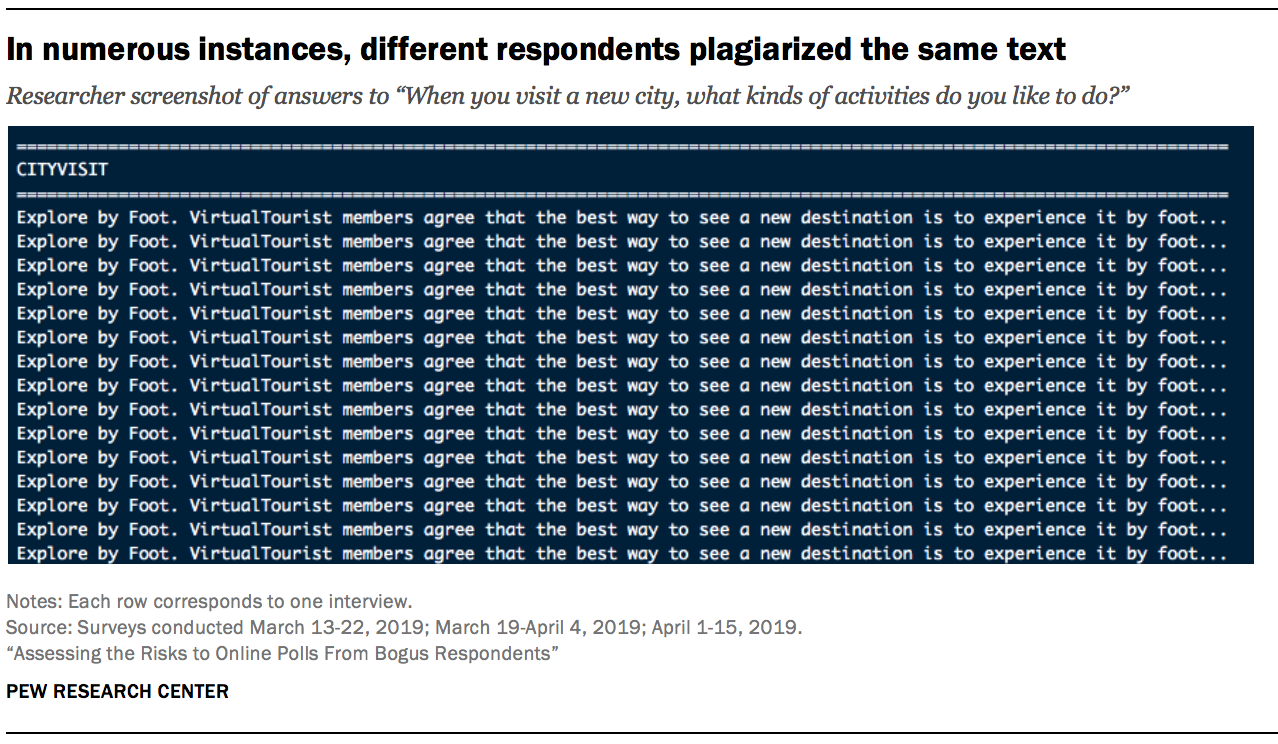
Those who plagiarized did not do so consistently. Of the 201 plagiarizers, only seven were found to have plagiarized answers for all six open-ends. On average, respondents detected doing this at least once gave plagiarized answers to two of the six open-ends. When the plagiarizers appeared to answer on their own, the results were not good. Their other answers were often non sequiturs as well, just not plagiarized. For example, it was common for plagiarizers to answer “When you were growing up, what was the big city nearest where you lived?” by giving the name of a state. This is suggestive of perhaps a vague but not precise understanding of the question. The inconsistent reliance on plagiarism is more suggestive of a human answering the survey than a bot.
And while plagiarized answers were found for each open-end, the question asking respondents what they would like to see elected leaders in Washington get done was by far the most likely to elicit this behavior. Researchers detected 176 plagiarized answers to that question. The second highest was 78 plagiarized answers to “When you visit a new city, what kinds of activities do you like to do?”
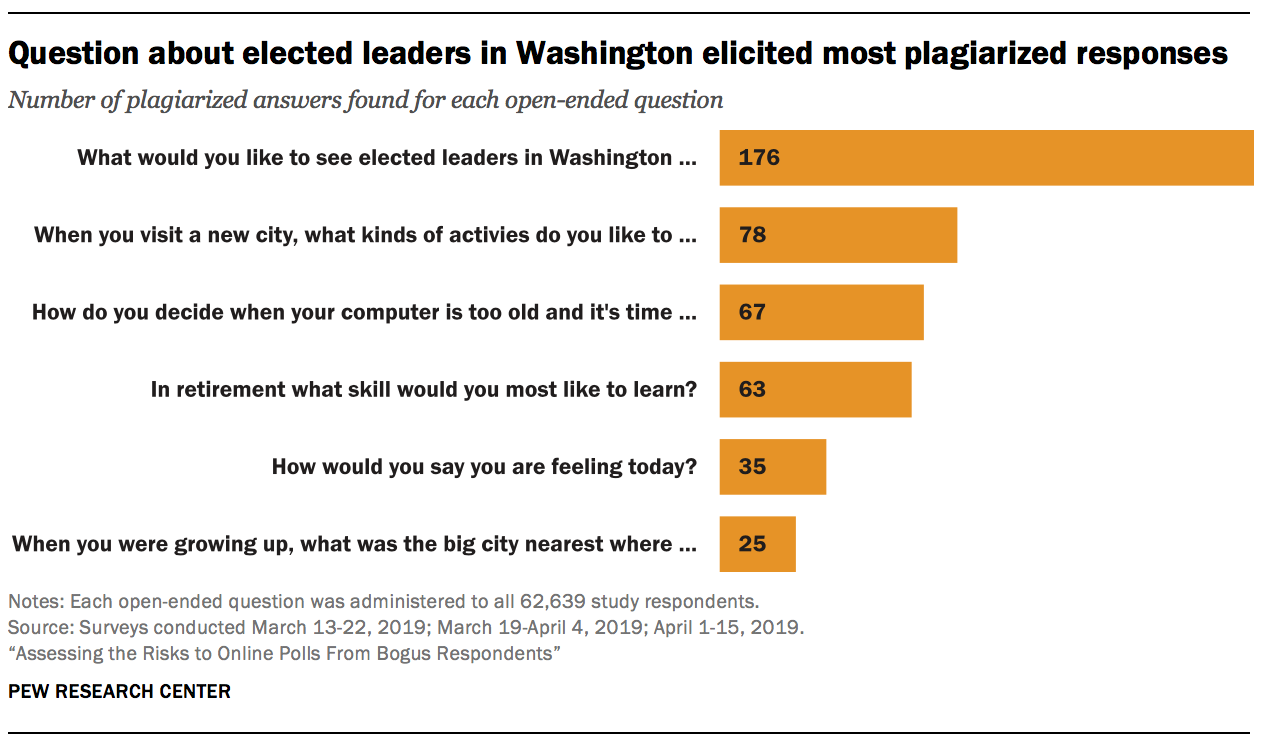
The question about elected leaders in Washington appears to have been the Waterloo for untrustworthy respondents for at least two reasons. One is the homonym “Washington,” and the other is conceptual difficulty. It was serendipitous that the top search result for “What would you like to see elected leaders in Washington get done during the next few years?,” was https://www.mountvernon.org/george-washington/the-first-president/election/10-facts-about-washingtons-election/, which is clearly the wrong meaning of “Washington.” In total, 117 respondents answered the question with text plagiarized from this or another online biography of the first U.S. president.
Apart from the homonym, it seems likely that some respondents found this question more difficult to answer. Questions like “How are you feeling today?” require no special knowledge and can be answered in a word or two. By contrast, this question about elected officials achieving unspecified goals almost certainly posed a greater cognitive challenge.
Additionally, the instruction to “Please give as much detail as you can” alerted respondents to the fact that longer answers were desirable. It seems plausible that some people felt comfortable answering the simpler questions on their own but looked for a crutch to come up with an answer to the elected leaders question. These two characteristics of having a homonym with multiple popular meanings and probing a relatively challenging topic may prove useful to researchers writing future questions designed to identify untrustworthy respondents.
Some respondents answered as though they were reviewing a product
About 15% of all the non sequitur answers sounded like a product review. For example, when asked, “When you were growing up, what was the big city nearest where you lived?,” over 150 respondents said “excellent,” “great,” “good,” or some variation thereof.13 More pointed answers included “awesome stocking stuffers” and “ALL SERVICES SOUNDS VERY GOOD.” None of these answers are responsive to the question posed. Researchers coded whether these evaluations were positive or negative and found that almost all of them (98%) were positively valanced.
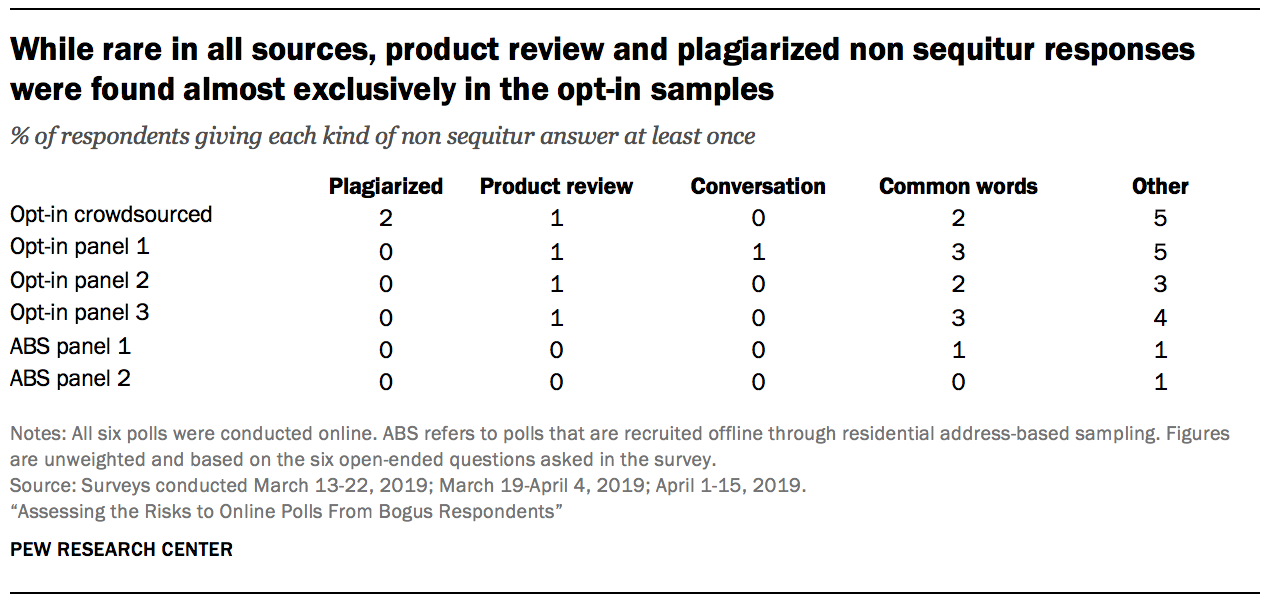
While rare in all the sources tested, product review sounding answers were found almost exclusively in the opt-in samples. Researchers found that 1% of the respondents in the crowdsourced sample and each of the opt-in samples gave a product-review sounding answer to at least one of the open-ends, compared to 0% of the address-recruited respondents.
There are two plausible explanations that stand out as to why some respondents offered these bizarre answers that had nothing to do with the question. Opt-in surveys are routinely (if not mostly) used for market research – that is, testing to determine how best to design or market a product like insurance, automobiles, cosmetics, etc. If someone were looking to complete a high volume of opt-in surveys with minimal effort, they might simply give answers assuming each survey is market research. If one assumes that the question is asking about a product, then rote answers such as “I love it” and “awesome” would seem on target.
A second explanation stems from the fact that many online surveys end with a generic open-ended question. For example, questions like “Do you have any feedback on this survey?” or “Do you have any additional comments?” are common. Even if a respondent did not necessarily assume the survey was market research, they may have assumed that any open-ended question they encountered was of this general nature. In this scenario, answers like “good” or “I like so much” offer rote evaluations of the survey itself rather than a product asked about in the survey.
A few of the non sequitur answers explicitly talked about a product (“Great product,” “product is a good,” “ITS IS EXCELLENT BRAND I AM SERVICE.”), presumably placing them under the first explanation. Other answers explicitly talked about the survey (“this was a great survey,” “I love this survey I want more”), presumably placing them under the second explanation. Far more non sequitur answers, though, simply offered comments like “good” or “great,” making it impossible to know what they were intended to reference. The commonality with all of these cases is that they offered an evaluation that may have made sense for a different (perhaps market research) survey but was unrelated to the question asked.
Some answers sounded like snippets of a conversation between two people
The study also found respondents giving non sequitur answers that sounded like snippets from a personal conversation. For example, when asked what was the big city nearest where they grew up, one respondent said, “Yes we can have dinner at the” and another said, “I love love joe and ahhh so much fun and joe and joe joe.” The repetition of words exhibited by the latter answer is common among these conversational sounding non sequiturs.
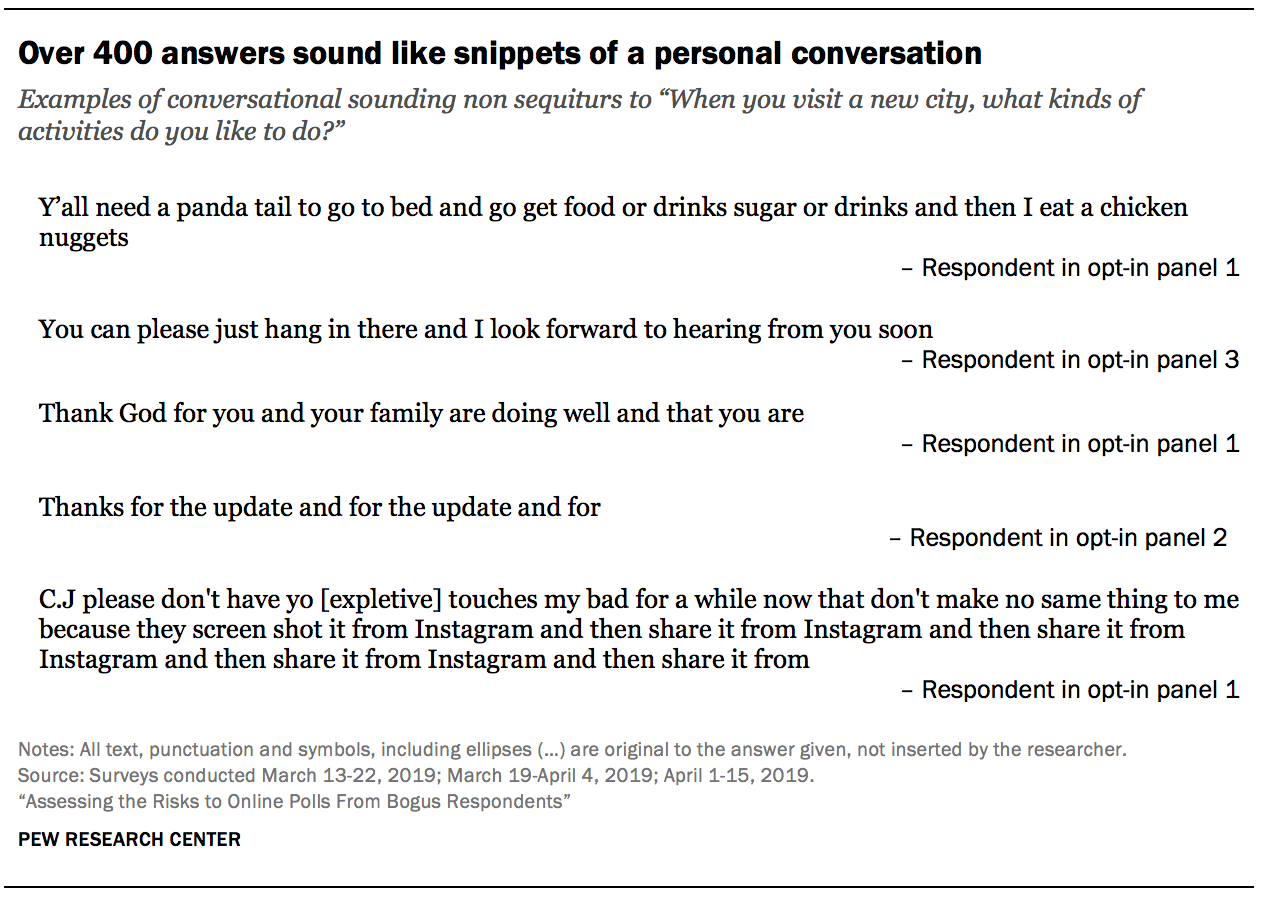
A likely explanation for these types of responses is the use of predictive text features on mobile devices. When a smartphone user begins typing, most smartphones attempt to predict the desired word and offer suggestions for words that are likely to come next based on that person’s prior texts and emails. These features are intended to reduce the amount of typing that users need to do on their devices. However, repeatedly tapping the predictive text results in sequences where each consecutive word would plausibly follow the one that came before it in a conversation but are otherwise meaningless.
Indeed, virtually all (99%) of respondents giving multiple conversational non sequiturs completed the survey on a mobile device (smartphone or tablet). Overall, 53% respondents in the study answered on a mobile device (this does not include the crowdsourced sample, for which device type was not captured).
In general, these conversational sounding answers are exceedingly rare. Less than 1% of all respondents in the study gave an answer of this type. When they did occur, these answers were concentrated in two of the opt-in samples. Of the 134 total respondents giving at least one conversational non sequitur answer, 46% were in opt-in panel 1 and 37% were in opt-in panel 3. The crowdsourced poll and opt-in panel 2 accounted for an additional 8% and 7% of these respondents, respectively.
Many non sequitur answers were just common words
In total, researchers identified five types of non sequitur answers: those that looked like a product evaluation, plagiarism, snippets of conversation, common words, and other/miscellaneous. Most non sequitur answers fell into those last two groups. For example, when asked “How would you say you are feeling today?,” 40 respondents said “yes” or “si” and an additional 42 respondents said “no.” Such answers were coded as non sequiturs using common words.
The bucket of other/miscellaneous non sequiturs contained any non sequitur that did not fall into the other four buckets. To give some examples, when asked “How would you say you are feeling today?,” other/miscellaneous non sequitur answers included “Bedroom Pop,” “Bot,” and “content://media/external/file/738023”. These answers were relatively heterogeneous with no clear explanation as to how they were generated.
Giving the same answer to six different open-ended questions
Giving the exact same answer to each of the six open ended questions is another suspicious pattern. Typically, these were single word answers such as “Yes,” “like,” or “good”. Of all the patterns in this study that could be indicative of a bot as opposed to a human respondent, this is perhaps the most compelling. That said, it is far from dispositive. A human respondent who is satisficing could generate the same pattern.
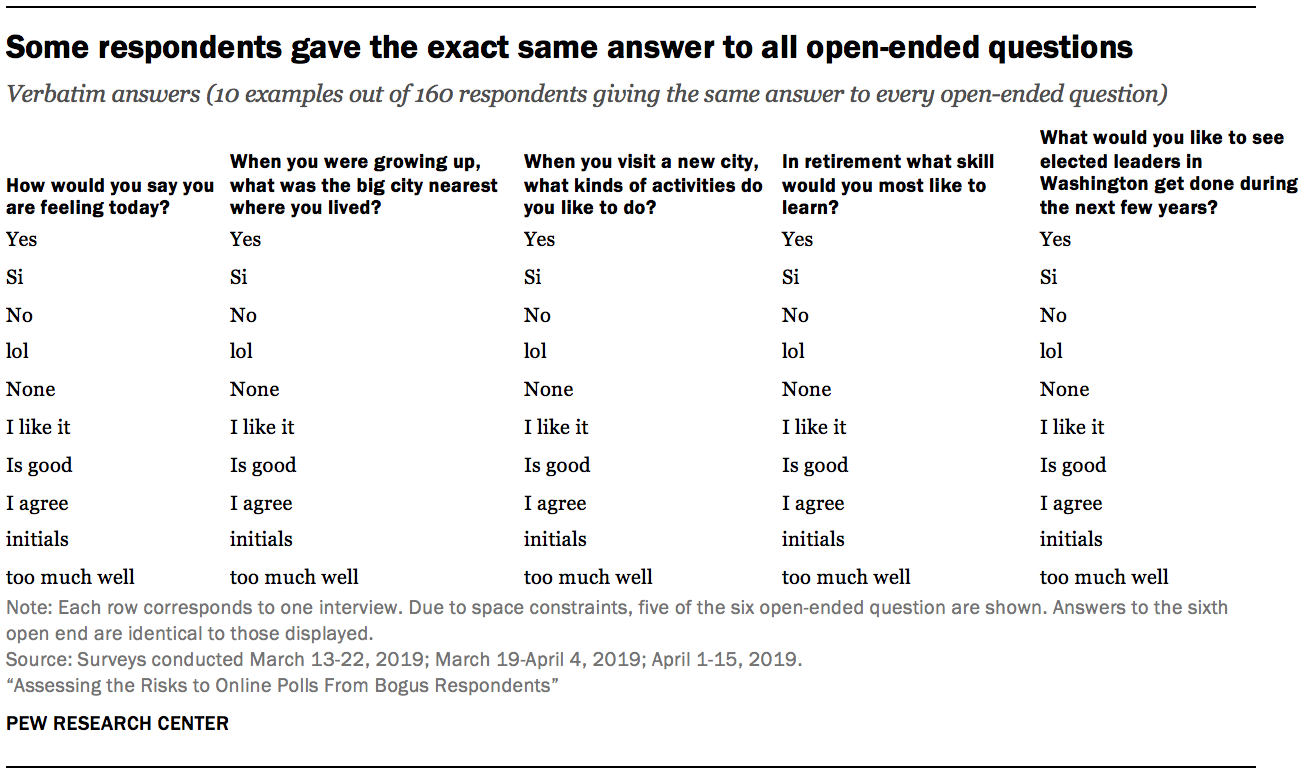
Giving the exact same answer to all six open-ended questions is exceedingly rare. The overall study incidence is less than one percent (0.3%). Due to the study’s very strong statistical power, it is possible to detect variation across the sample sources. This behavior was almost completely absent (0.0%) from the crowdsourced sample as well as the two address-recruited panel samples. Among opt-in panels, however, roughly 1-in-200 respondents did this (0.5%). The incidences were similar across the opt-in panels, ranging from 0.4% to 0.6%.


