For Latino voters, the economy is the top issue, followed by health care, violent crime and gun policy

Pew Research Center conducted this analysis to understand Latino voters’ views of the 2024 U.S. presidential election. For this analysis, we surveyed 9,720 U.S. adults – including 691 Latino registered voters – from Aug. 26 to Sept. 2, 2024, in English and Spanish.
Everyone who took part in this survey is a member of the Center’s American Trends Panel (ATP), a group of people recruited through national, random sampling of residential addresses who have agreed to take surveys regularly. This kind of recruitment gives nearly all U.S. adults a chance of selection. Surveys were conducted either online or by telephone with a live interviewer. The survey is weighted to be representative of the U.S. adult population by gender, race, ethnicity, partisan affiliation, education and other factors. Read more about the ATP’s methodology.
Here are the questions used for this report, the topline, and the survey methodology.
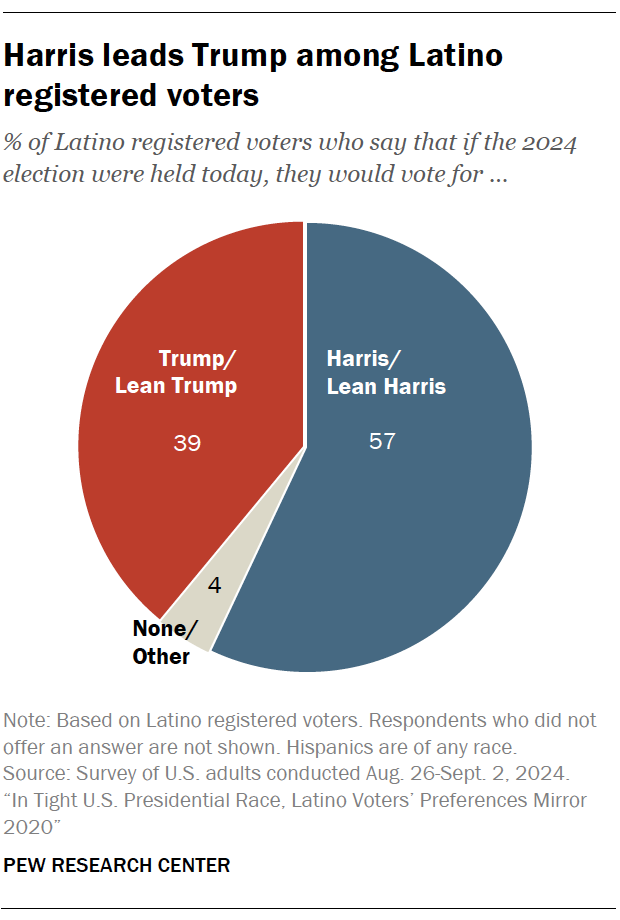
As the final leg of the presidential campaign begins following an eventful summer, a majority of Latino registered voters (57%) say they would vote for Vice President Kamala Harris and 39% would vote for former President Donald Trump, according to a Pew Research Center survey conducted Aug. 26-Sept. 2, 2024.1
Harris performs substantially better among Latino voters than President Joe Biden did when he was the likely Democratic nominee. In July – after the first presidential debate but before Trump was injured in a shooting at a campaign rally – equal shares of Latino voters said they would vote for Biden as for Trump (36% each) while 24% favored Robert F. Kennedy Jr. In a two-way matchup, 51% of Latino voters said in July that they’d support Biden and 46% said they’d back Trump – a narrower margin for Biden than for Harris today.
The presidential preferences of Latinos look similar to 2020, when Biden defeated Trump 61% to 36% among Latinos who voted. (Jump to more about 2024 presidential preferences among demographic groups of Latino voters.)
Supporters of both candidates have largely made up their minds. Among Latino registered voters, 79% of Harris supporters and 77% of Trump supporters say they are certain to vote for their candidate. By comparison, among all U.S. registered voters, at least eight-in-ten Harris and Trump supporters say they are certain to vote for their candidate.
When it comes to their vote choice, Latino Harris and Trump backers give different reasons for their support.
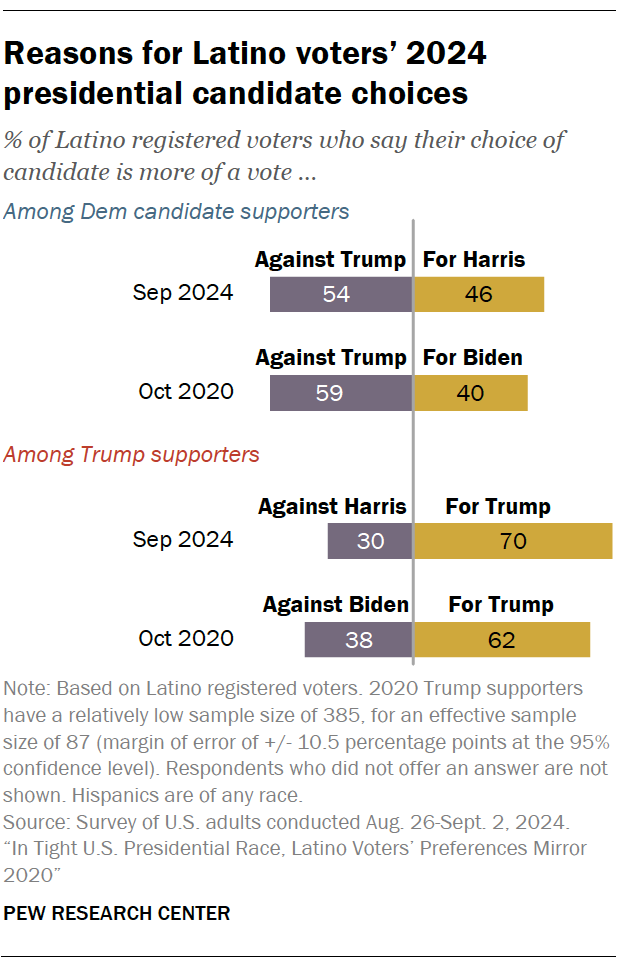
- 70% of Latinos who back Trump say their choice is more a vote for Trump than against Harris. This is a slightly bigger share than in October 2020, when 62% of Latino Trump supporters said their choice was a vote for Trump.
- By contrast, Latinos backing Harris give mixed reasons for their vote choice: 54% say their vote is more a vote against Trump than for Harris, while 46% say it’s a vote for Harris. Notably, this is similar to what Latino Biden supporters expressed in October 2020, when 59% said their vote was more of a vote against Trump.
On issues, 85% of Latino voters say the economy is very important to their vote in this year’s presidential election, followed by health care (71%), violent crime (62%), gun policy (62%), immigration (59%) and Supreme Court appointments (58%).
Yet Latino voters who support Trump and Harris prioritize different issues. Among Trump’s Latino supporters, the economy (93%), violent crime (73%) and immigration (71%) are the three most-cited issues important to their vote. By contrast, for Latinos who back Harris, the economy (80%), health care (78%) and gun policy (66%) are the three top issues. Notably, immigration was cited by 51% of Harris Latino voters as important for their vote for president – the second-lowest share among the 10 issues asked about in the survey. (Jump to more about what Latino voters see as top issues.)
In 2024, 36.2 million Latinos are eligible to vote (i.e., they are adult U.S. citizens), up 4 million since 2020 and more than double the 14.3 million Latino eligible voters in 2000. As a result, Latino voters are now the nation’s second-largest group of eligible voters – ahead of Black voters and Asian American voters and behind White voters. With so many Latino eligible voters nationally, they make up notable shares of voters in several of this year’s battleground states.
Pew Research Center’s bilingual national survey of 9,720 adults (including 691 Latino registered voters), conducted from Aug. 26 to Sept. 2, 2024, explores views and attitudes about the presidential election since Biden withdrew from the race and Harris became the Democratic nominee. It was fielded prior to the Sept. 10 presidential debate.
This report explores the views of Latino registered voters about the 2024 presidential candidates and election.
Latino voters and the Harris-Trump match up
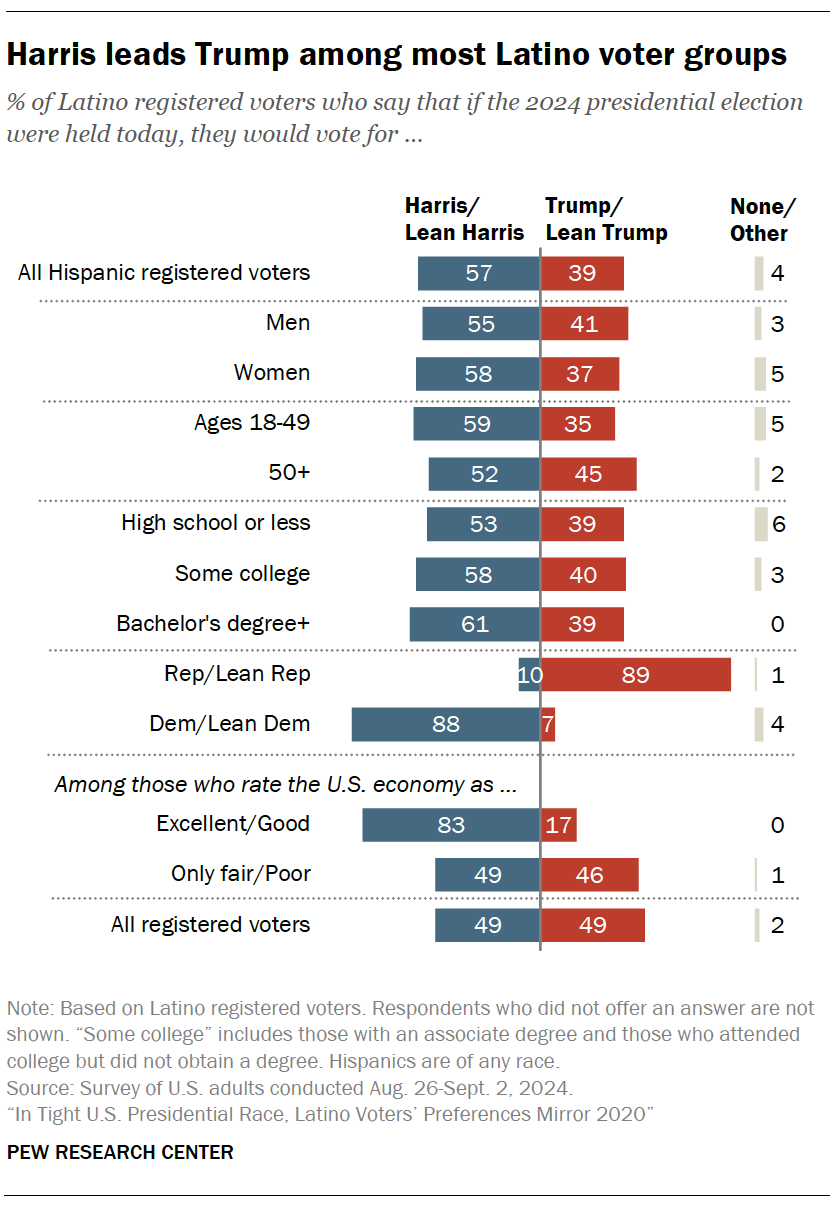
Harris has an advantage over Trump in just about all major demographic subgroups among Latino voters, though some notable differences exist.
- Gender: Harris leads among both Hispanic women (58%) and men (55%). About four-in-ten Hispanic men (41%) and women (37%) say they would vote for Trump.
- Age: 59% of Latino voters under 50 support Harris while 35% say they support Trump. Among voters ages 50 and older, 52% support Harris and 45% support Trump, highlighting an age gap in support for both candidates.
- Education: Harris leads across all education groups among Latino voters. Meanwhile, Trump support is about the same among each group.
- Economic conditions rating: Latino voters who rate economic conditions as only fair or poor are split between Harris (49%) and Trump (46%). Meanwhile, Harris has overwhelming support among Latino voters who rate economic conditions as excellent or good: 83% say they support Harris, while 17% say the same for Trump.
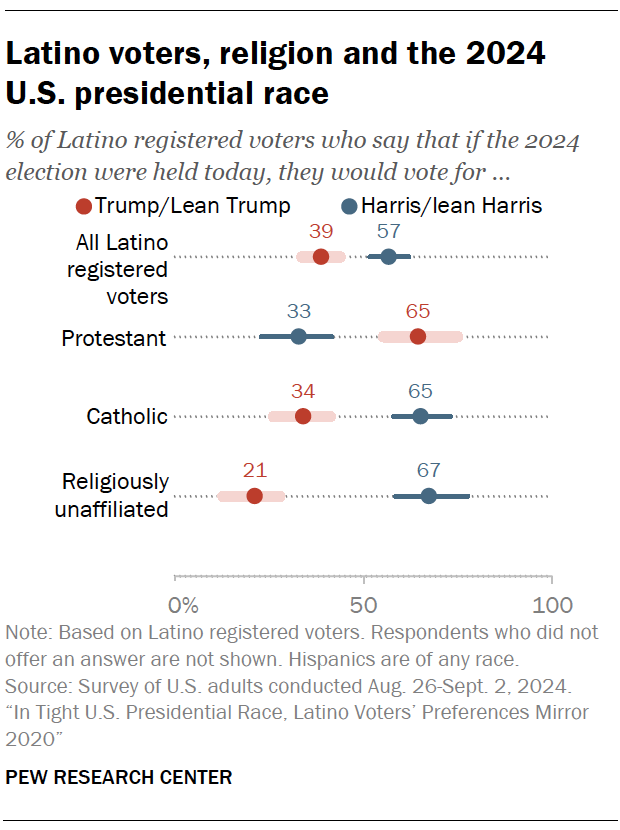
- Religion: 65% of Latino Protestants say they plan to vote for Trump, while Harris has majority support among Hispanic Catholics (65%) and religiously unaffiliated Hispanics (67%).
Top issues for Latino Harris and Trump supporters in 2024
When it comes to issues that are very important to their vote this year, 85% of Latino registered voters say the economy matters most among the 10 issues included in the survey. Following the economy are the issues of health care (71%), violent crime (62%), gun policy (62%) and immigration (59%).
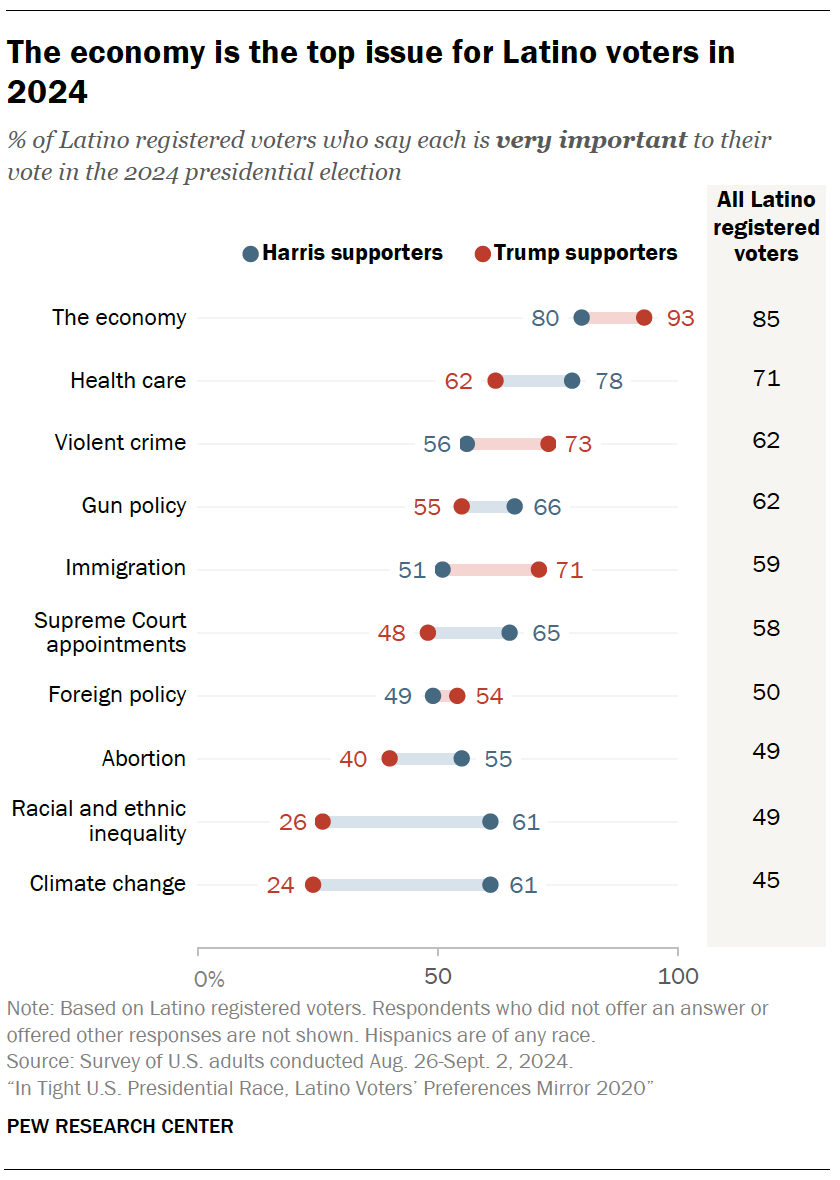
Nonetheless, Latinos who back Harris and Trump prioritize issues differently:
- The economy is the top issue for both Latino Trump and Harris supporters, but Latino Trump backers are more likely to say the economy is very important to their vote (93% vs. 80%).
- For Latino Harris supporters, the most important issues after the economy are health care (78%), gun policy (66%), Supreme Court appointments (65%) and racial and ethnic inequality and climate change (61% each). Another 51% say immigration is very important to their vote this year, the second-lowest rated issue for Latino Harris supporters.
- For Latino Trump supporters, the top issue after the economy is violent crime (73%), followed by immigration (71%), health care (62%), gun policy (55%) and foreign policy (54%).
The pattern of top issues for Latino Harris and Trump supporters in many ways mirrors that among all Harris and Trump supporters, though there are some differences.
- Trump supporters overall are just as likely as Latino Trump supporters to rate the economy as very important to their vote this year – 93% in each group says this. On the issue of immigration, 82% of all Trump supporters say this is a very important issue for them while 71% of Latino Trump supporters say the same.
- Among all Harris backers, the leading issues are health care (76%) and Supreme Court appointments (73%). Among Latino Harris supporters, the economy is the top issue, with a higher share saying this than among all Harris supporters (80% vs. 68%). On immigration, Latino Harris backers are more likely than all Harris backers to say the issue is very important to their vote (51% vs. 39%).
When it comes to Latino voters’ confidence in the candidates, Harris holds a significant advantage over Trump on most issues.
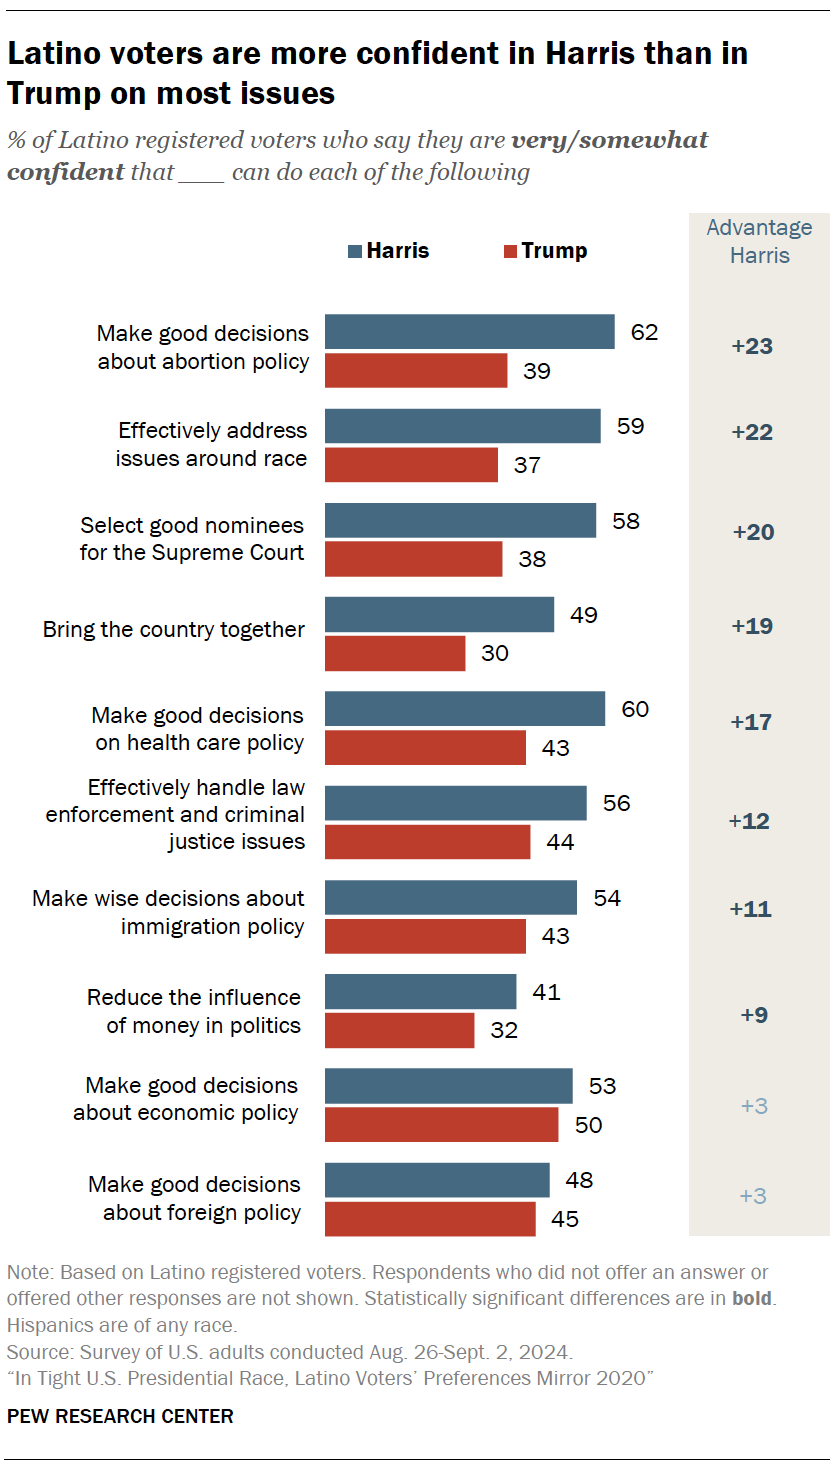
- Abortion: 62% of Latino registered voters say they have confidence that Harris can make good decisions about abortion policy; 39% say the same about Trump.
- Issues around race: 59% of Latino voters say they have confidence Harris can make good decisions on this topic while 37% say the same about Trump – a 22 percentage point advantage for Harris.
- Supreme Court nominees: When it comes to selecting good nominees for the Supreme Court, 58% say they have confidence in Harris while 38% say the same about Trump.
On immigration policy, 54% of Latino voters say they have confidence in Harris to make wise decisions while 43% say the same about Trump – an 11-point edge for Harris. But among all registered voters, Trump has a 7-point lead: 52% say they are confident Trump can make wise decision about immigration policy, while 45% say the same about Harris.
And on economic policy, Harris does not have a significant advantage over Trump among Latino voters. This contrasts with all registered voters, 55% of whom say they have confidence in Trump to make good decisions about economic policy while 45% say this about Harris – a 10- point advantage for Trump.
Latino voters and national economic conditions
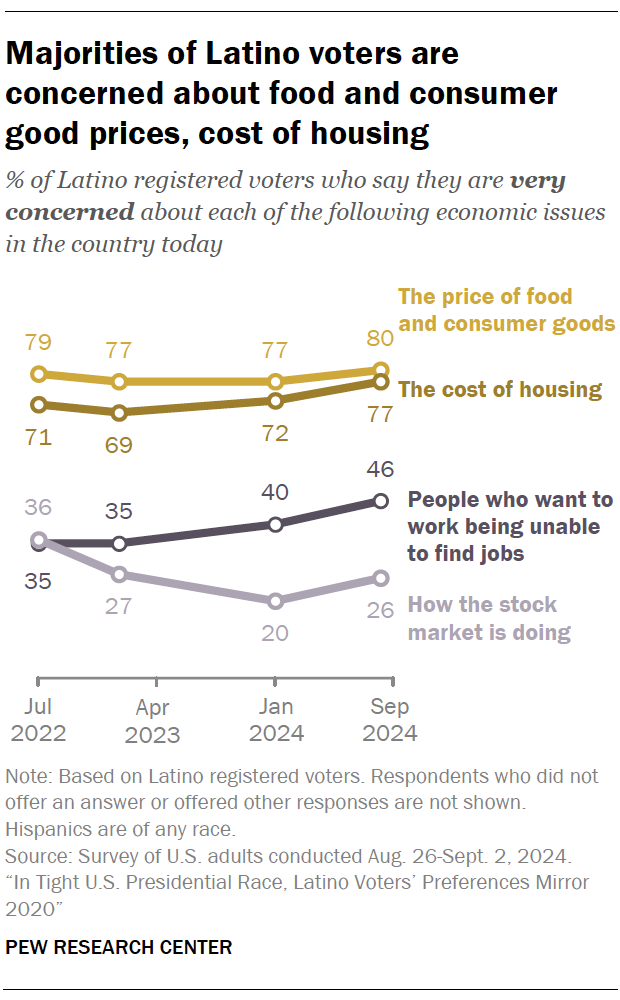
Economic issues have been top of mind for Latino voters in recent years.
- 80% of Latino registered voters say they are very concerned about the price of food and consumer goods today.
- 77% say they are very concerned about the cost of housing, up from 71% in 2022.
- 46% say they are very concerned about people who want to work being able to find jobs, up from 36% in 2022.
The survey also finds that Latino registered voters are downbeat about the state of the U.S. economy. About three-quarters (77%) rate national economic conditions as only fair or poor. However, Latino Trump backers are more likely than Latino Harris backers to rate economic conditions this way (90% vs. 66%).
Looking ahead to the next year, Latino voters express mixed views about future economic conditions. About four-in-ten (39%) expect better conditions, 22% expect worse conditions and 38% expect conditions to be the same as about now. Views are similarly mixed among both Latino Trump and Harris supporters.
How Latino voters view the candidates’ personal traits
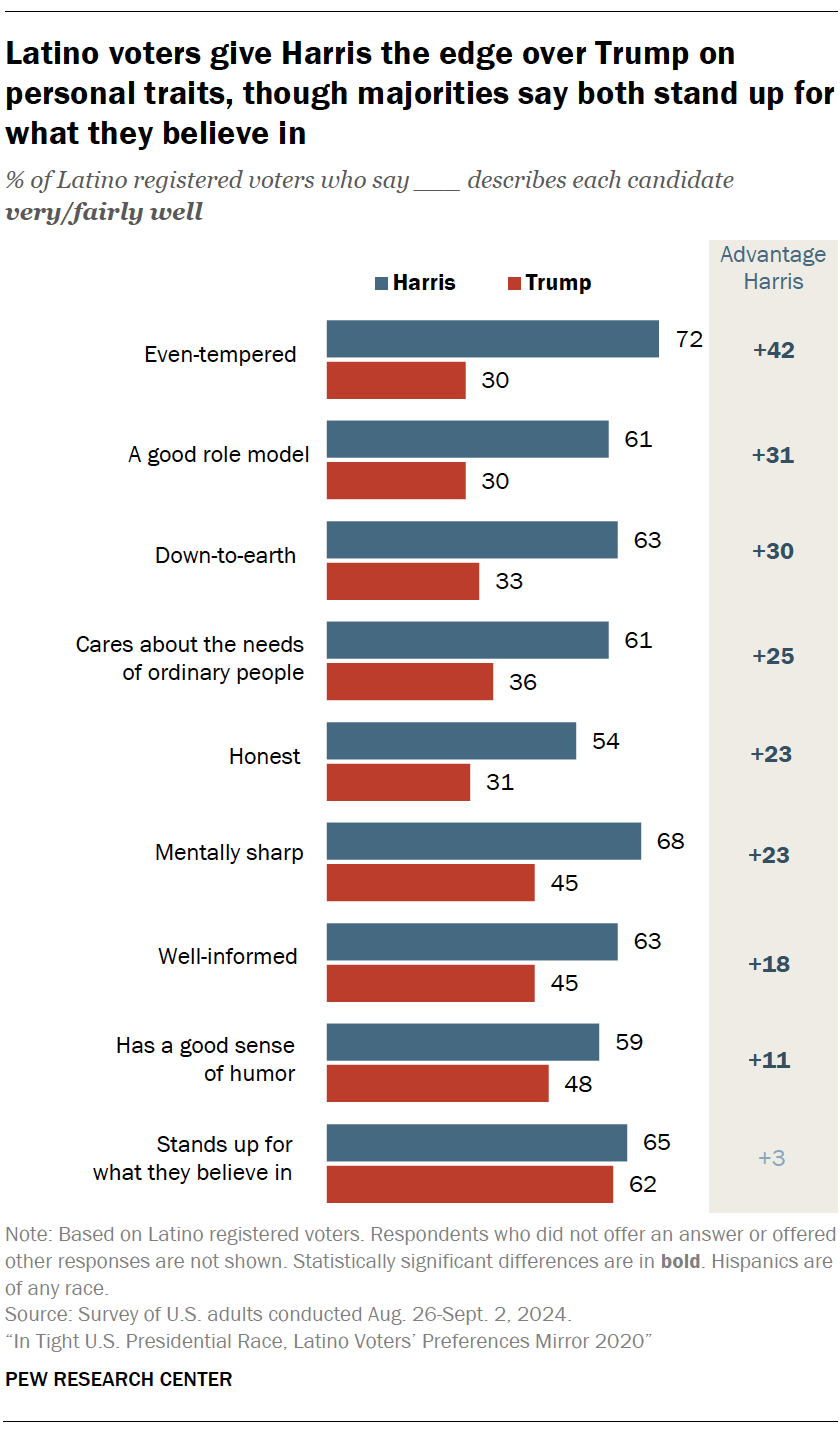
About twice as many Latino voters see Harris as even-tempered, a good role model and down-to-earth than say these traits describe Trump. Harris also has a wide advantage over Trump on all but one of the personal characteristics asked about in the survey.
- 72% of Latino voters say “even-tempered” describes Harris very or fairly well, while 30% say the same about Trump – a 42-point advantage for Harris.
- 61% of Latino voters see Harris as “a good role model,” while 30% say the same about Trump.
- 63% say “down-to-earth” describes Harris very or fairly well; 33% of Latino voters say this about Trump.
- 68% describe Harris as “mentally sharp” while 45% say the same about Trump – a 23-point advantage for Democratic candidate.
Harris also leads Trump on being seen as “well-informed” by Latino voters (63% vs. 45%). And more Latino voters say Harris “has a good sense of humor” than say this about Trump (59% vs. 48%).
Trump does not hold an advantage over Harris on any personal characteristic we asked about. However, similar majorities of Latino voters say Harris and Trump stand up for what they believe in (65% vs. 62%).
How the candidates make Latino voters feel
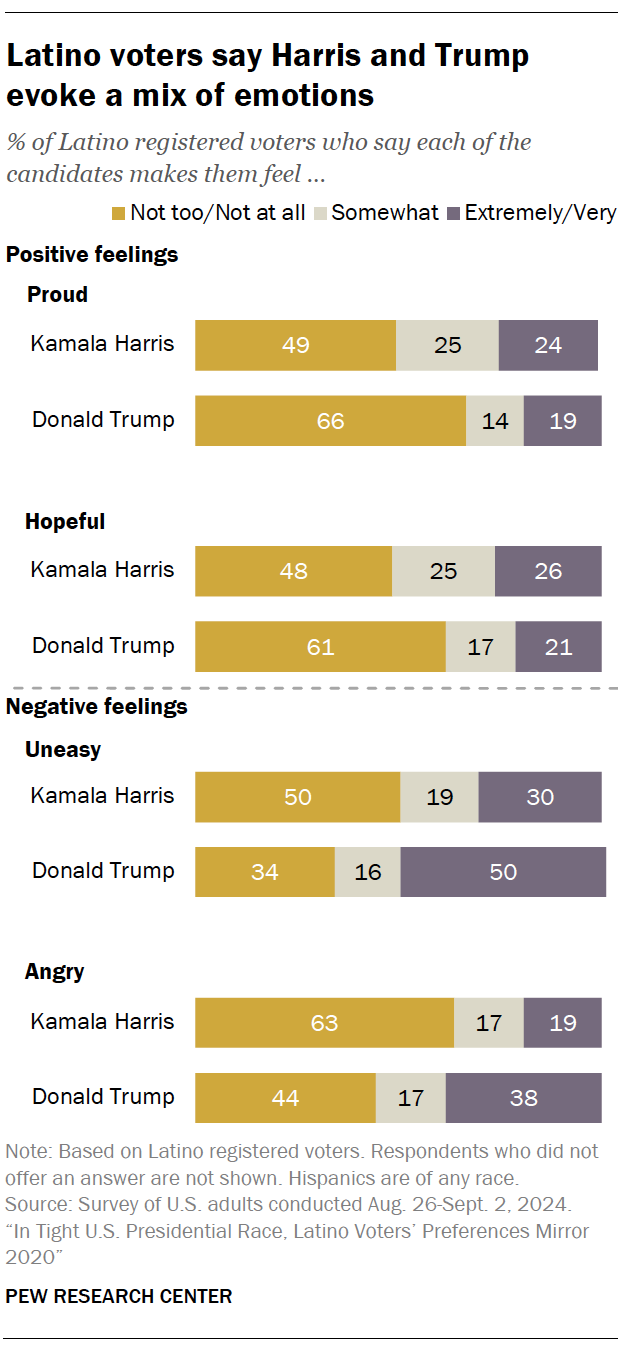
Latino voters say Harris and Trump make them feel a mix of positive and negative emotions.
- Pride: 24% of Latino registered voters say Harris makes them feel extremely or very proud, while 19% say Trump makes them feel this way. Notably, 49% say Harris makes them feel not too or not at all proud, and 66% say this about Trump.
- Hope: 26% of Latino voters say Harris makes them feel hopeful, while 21% say this about Trump. Meanwhile, 61% say Trump makes them feel not too or not at all hopeful; 48% say this of Harris.
- Unease: 30% of Latino voters say they feel uneasy about Harris, but half say this about Trump.
- Anger: 19% of Latino voters say Harris makes them feel extremely or very angry; 38% say Trump makes them feel this way.
Does Harris’ and Trump’s race and ethnicity, gender and age matter to Latino voters in the 2024 election?
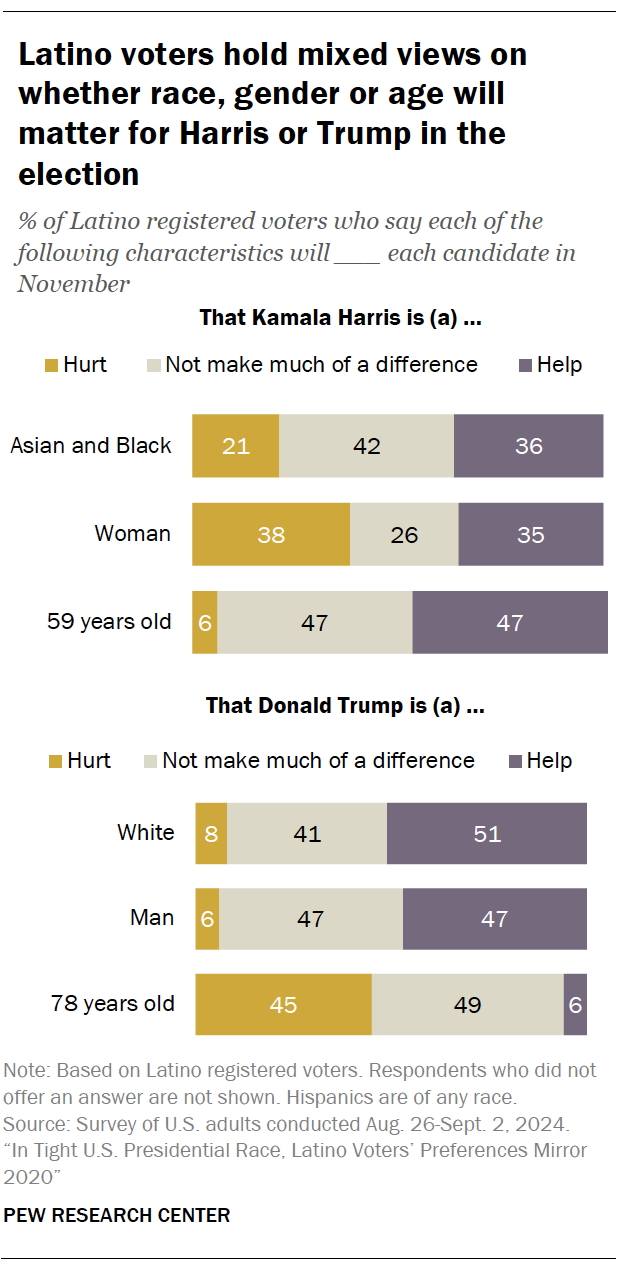
This year’s presidential election will produce a national historic first one way or the other. If Harris is elected, she would be the first woman, first Black woman and first Asian person to be serve as president. If Trump is elected, he would be the oldest president, at age 78.
Overall, Latino voters have mixed views on how much these characteristics might help or hurt the candidates.
Kamala Harris
- 36% say Harris’ Asian and Black background will help her in November, 42% say it won’t make much of a difference, and 21% say it will hurt her chances.
- 35% say being a woman will help Harris’ candidacy, 26% say it won’t make much of a difference, and 38% say it will hurt.
- 47% say Harris’ age (59 years old) will help her in the election, while another 47% say her age won’t make much of a difference.
Donald Trump
- 51% of Latino voters say being White will help Trump’s candidacy, while only 8% say it will hurt. Another 41% say it won’t make a difference in November.
- Latino voters are split on the impact of Trump’s gender: 47% say being a man will help him, while an equal share say it won’t make much of a difference. Very few say it will hurt him.
- 45% say Trump’s age (78 years old) will hurt his chances in November, while 49% say it won’t make much of a difference.
Latino voters and engagement with the 2024 presidential election
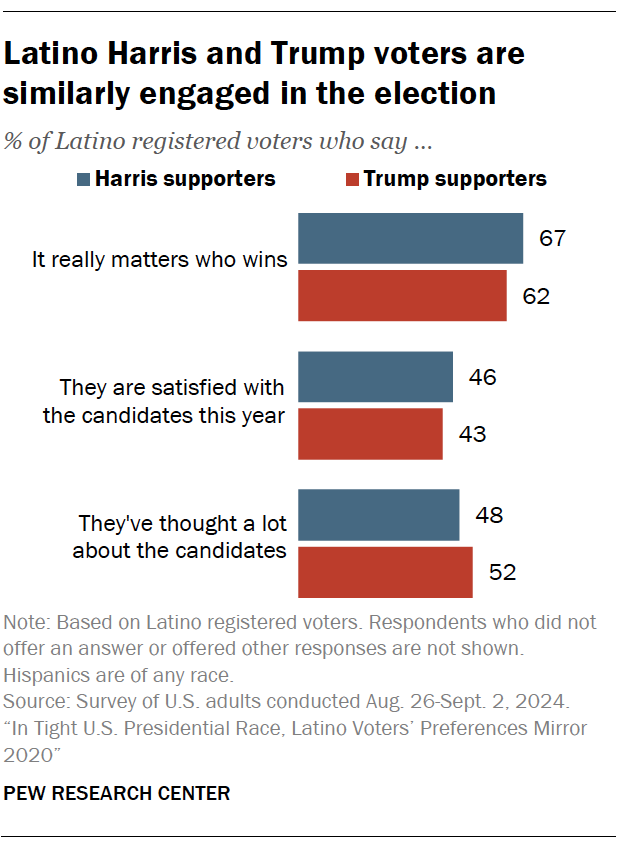
Latino registered voters have been less engaged than other registered voters in this year’s presidential election. Nonetheless, at this point in the election, Latinos who support Harris and Trump are about equally engaged.
Does it matter who wins?
- 64% of Latino registered voters say it really matters who wins the election.
- Latinos who support Harris are slightly more likely than those who support Trump to say it really matters who wins (67% vs. 62%).
Satisfaction with the candidates running for president
- 43% of Latino registered voters say they are satisfied with the presidential candidates. This is up from 28% who said the same in July, before Biden exited the race. (At that time, 71% of Latino registered voters said they were not too or not at all satisfied with the presidential candidates.)
- Similar shares of Latinos who support Harris and Trump say they are satisfied with the candidates running for president (46% vs. 43%).
How much have Latino voters thought about the candidates?
- 49% of Latino registered voters say they have given a lot of thought to the candidates who are running for president in 2024.
- Among Latinos who support Harris, 48% say they have given a lot of thought to the presidential candidates, compared with 52% of those who support Trump.
CLARIFICATION (September 25, 2024): In the third paragraph, the following sentence was updated to reflect the presidential preferences of Latino voters in 2020 due to a revised weighting approach we implemented in 2022: “The presidential preferences of Latinos look similar to 2020, when Biden defeated Trump 61% to 36% among Latinos who voted.” For more information, see the methodology for our 2022 validated voters report.


