Data sources
The analysis in this report is based on the combination of work requirements and job skills data from the U.S. Department of Labor’s Occupational Information Network (O*NET, Version 27.3) and data on the occupation, employment and wages of workers from the Current Population Survey (CPS). Additional analysis is based on a Pew Research Center survey of 11,004 U.S. adults conducted from Dec. 12 to 18, 2022.
Occupational Information Network (O*NET): The O*NET database provides a variety of information related to the requirements of about 900 occupations. The occupations are classified according to a coding scheme that is consistent with the 2018 Standard Occupational Classification. Among other things, O*NET includes information on 41 work activities and 35 specific skills representing occupational and worker requirements for job performance (working with computers or critical thinking, for example). Each work activity or skill is rated on a scale of 1 to 5 measuring its importance to job performance, from not important to extremely important. This report focuses on the importance ratings of the 41 work activities, but also examines the relationship between the importance of job skills and the exposure of work activities to AI. The ratings are based on information generated by trained job analysts and surveys of job incumbents.
Current Population Survey (CPS): Conducted jointly by the U.S. Census Bureau and the Bureau of Labor Statistics, the CPS is a monthly survey of about 60,000 households and is the source of the nation’s official statistics on unemployment. The CPS sample covers the civilian, noninstitutionalized population. Employment status is available for all eligible persons 16 or older, and data on earnings are available for about one-quarter of the sample. The CPS lists nearly 500 occupations that are an aggregation of the more detailed occupations listed in O*NET. In this report, 12 monthly CPS files were combined to generate annual estimates of occupational employment and earnings in 2022. The CPS microdata files used in this report are the Integrated Public Use Microdata Series (IPUMS-CPS) provided by the University of Minnesota.1
Classifying work activities by exposure to AI
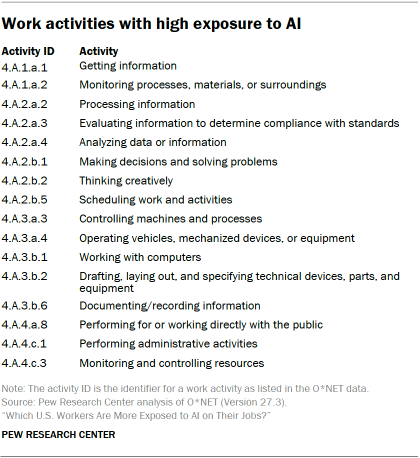
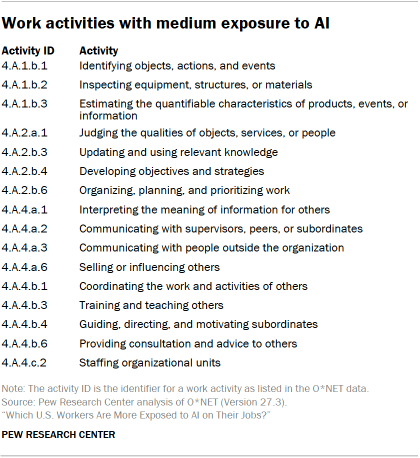
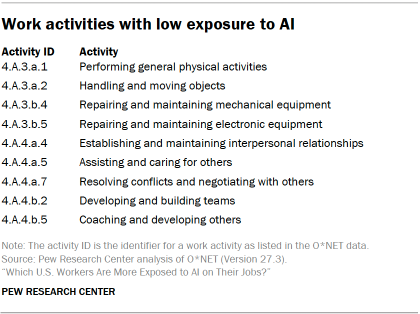
The 41 work activities listed in O*NET were classified as having low, medium or high exposure to AI based on the collective judgment of Center analysts. This process, described in greater detail in the body of the report, resulted in the following classification of work activities, where 16 activities are judged to have high exposure, 16 more have medium exposure and nine have low exposure:


Determining the level of exposure of a job to AI
The 41 work activities we focus on are listed as requirements for all occupations in the O*NET. This means that each occupation is a mix of low, medium and high AI-exposure activities and has at least some exposure to AI. The question then is: Which of these three groups of activities is relatively the most important for an occupation?
To determine this, we performed four steps of analysis. First, we estimated the importance rating for low-, medium- and high-exposure activities in each job. The individual work activities that comprise each exposure group are rated on a scale of 1 to 5 measuring its importance to job performance, from not important to extremely important. These ratings are as listed in the O*NET. The average of the importance ratings for the individual work activities that make up the low, medium and high exposure groups is the importance rating of that exposure group.
For instance, the importance of high-exposure activities overall in a job is the average of the importance ratings of 16 individual high-exposure activities in that job. For mechanical drafters, the importance ratings of high-exposure activities range from 4.72 for working with computers to 3.66 for documenting or recording information, and to 1.82 for monitoring and controlling resources. These ratings scores, along with the scores for the other 13 high-exposure activities, are averaged to yield an overall importance rating of 3.28 for high-exposure activities for mechanical drafters. (The full list of high-exposure activities is above.)
Overall, among the 873 occupations we looked at, activities with high exposure to AI rated as being important to extremely important in 77% of occupations (an average importance rating score of 3 to 5, on the overall scale of 1 to 5). Medium-exposure activities rated this important in 72% of occupations, and so did low-exposure activities in 39% of occupations. It is possible that high-, medium- and low-exposure activities could simultaneously be important in a job, i.e., have an average rating of 3.
The second step was to determine which low-, medium- or high-exposure activities in each job were more important than the others. The process may be illustrated by looking at the job of mechanical drafters. For them, the average importance ratings of the three groups of activities are as follows: low exposure – 2.16; medium exposure – 2.88; and high exposure – 3.28. In our ranking system, this meant that high-exposure activities are more important than other activities for mechanical drafters.
We took a third step for the sake of comparing across occupations by exposure to AI. This was to estimate the relative importance of each activity. For mechanical drafters, the sum of the importance ratings of low-, medium- and high-exposure activities is 8.32. The relative importance of low-exposure activities is 0.26 (or 2.16/8.32), that of medium-exposure activities is 0.35 (or 2.88/8.32), and that of high-exposure activities is 0.39 (or 3.28/8.32). These measures of the relative importance of activities were used to rank occupations. An occupation in which the relative importance of high-exposure activities is less than 0.39 – pharmacists, for instance – are less exposed to AI than mechanical drafters.
Which occupations are most or least exposed to AI
In the final step, we ranked occupations two ways: by the relative importance of low-exposure activities, and by the relative importance of high-exposure work activities. Jobs that are most exposed to AI are in the top 25% of occupations ranked by the relative importance of high-exposure activities. Jobs that are least exposed to AI are in the top 25% of occupations ranked by the relative importance of low-exposure work activities. Each set of occupations consists of about 218 occupations.
In principle, it is possible that there is overlap between the lists of the most and the least exposed occupations: There may be occupations in which both high- and low-exposure activities are relatively important in comparison with other occupations. Indeed, there is one occupation that appears on both lists – coin, vending, and amusement machine servicers and repairers. In this occupation, the relative importance of high-exposure activities is 0.36, followed by 0.34 for low-exposure activities. These scores are sufficient to place this occupation in the top 25% of either ranking. We leave it in place among both the most and the least exposed occupations.
As described below, the procedures for determining the exposure of jobs to AI were repeated after the O*NET data had been matched to the CPS data.
Matching O*NET and CPS data
The O*NET files do not contain data on the employment or wages of workers in individual occupations. For that reason, the work activity and skills importance ratings from O*NET were matched to data from the CPS, which does record that information. Although both the O*NET and the CPS use the same standard occupational classification, there is one key difference: O*NET lists about 900 occupations coded at the eight-digit level, the finest detail possible, whereas the CPS lists fewer than 500 occupations coded at the four-digit level. In other words, an occupation listed in the CPS typically encompasses more than one occupation listed in O*NET. Thus, some of the occupational data in O*NET must be combined to match with the CPS data. This was done in three steps, as detailed below:
Step 1: The work activity and skills importance ratings for eight-digit occupations in O*NET were aggregated to the six-digit level. For example, “financial managers,” a six-digit occupation (2018 SOC code 11-3031), is broken into two eight-digit occupations in O*NET: “financial managers” (code 11-3031.00) and “treasurers and controllers” (code 11-3031.01). The activity and skills ratings for these two eight-digit occupations in O*NET were averaged to estimate the ratings for financial managers at the six-digit level. This process was repeated as necessary, and the result was a set of importance ratings for about 750 six-digit occupations.
Step 2: The ratings for six-digit occupations were further aggregated to the four-digit level using an occupational crosswalk from the Bureau of Labor Statistics. For example, “education and childcare administrators,” a four-digit occupation, consists of the following three six-digit occupations: “education and childcare administrators, preschool and daycare,” “education and childcare administrators, kindergarten through secondary,” and “education and childcare administrators, postsecondary.” In this step of the aggregation process, the activity and skills ratings for the various education administrators are averaged using the employment in each occupation as the weight. If employment data were not available, simple averages of the ratings for six-digit occupations were used to estimate ratings for the broader four-digit occupations. The result of this process was work activity and skills ratings for 485 four-digit occupations that we could match to data on employment and earnings in these occupations from the CPS.
The combined O*NET and CPS dataset provides virtually complete coverage of U.S. employment. The 485 occupations in the dataset employed 148 million workers, close to the official government estimate of total U.S. employment of 158 million in 2022.
Which occupations are most or least exposed to AI: A second set of rankings with CPS data
After the 873 O*NET occupations had been matched to 485 CPS occupations, it was also necessary to rank the shorter list of occupations by their exposure to AI. The process for doing this was the same as described above. That is, the 485 CPS occupations were ranked two ways, by the relative importance of low- and high-exposure activities, respectively. As before, jobs that are most exposed to AI are in the top 25% of occupations ranked by the relative importance of high-exposure activities. Jobs that are least exposed to AI are in the top 25% of occupations ranked by the relative importance of low-exposure work activities. Each group consists of about 120 occupations. Examples of CPS occupations that are the most or least exposed are listed in the appendix.
Determining job skills
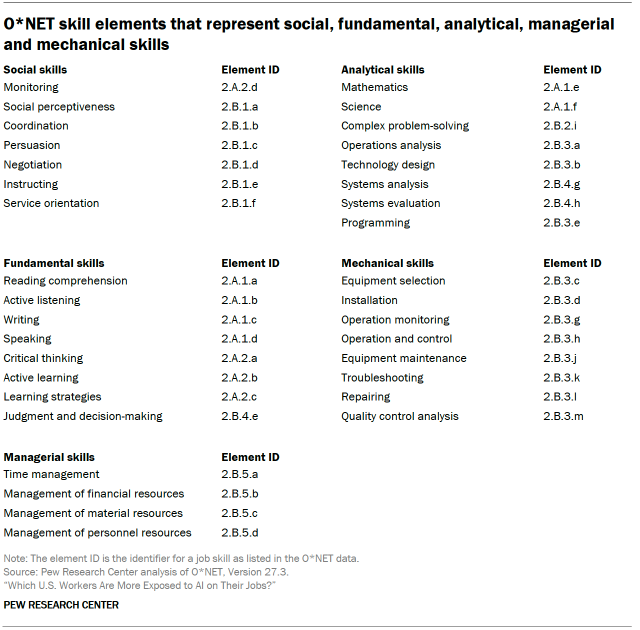
For some of the analysis, we group the 35 skills rated in the O*NET into five major families of job skills – social, fundamental, analytical, managerial and mechanical (refer to the table below). The grouping is similar to the O*NET classification of skill categories. In general terms, social skills refer to interpersonal skills; fundamental skills lay the foundation for acquiring other skills; analytical skills capture scientific and technological prowess; managerial skills pertain to the management of people, things and finances; and mechanical skills describe the ability to work with and to control machinery or equipment.

As with work activities, the importance of each detailed skill element to an occupation is given a numerical rating on a scale of 1 (not important) to 5 (extremely important) in the O*NET data. A simple average of the ratings of detailed skills is used to represent the importance of a skill group to an occupation.
For example, the O*NET, Version 27.3 importance rating for each of the seven social skills for chief executives is as follows: 4.12 for monitoring, 4.25 for social perceptiveness, 4.25 for coordination, 4.12 for persuasion, 4.12 for negotiation, 3.12 for instructing and 3.12 for service orientation. The average of these scores – 3.87 – is the measure of the importance of social skills for chief executives. A similar process is used to determine the importance ratings of fundamental (4.08), analytical (3.03), managerial (4.06) and mechanical skills (1.31) for chief executives.
Hourly wages
Wage estimates pertain to a worker’s main job. Workers paid by the hour report hourly wages. For workers who are not paid by the hour, the hourly wage is calculated as weekly earnings divided by the usual numbers of hours worked in a week. The CPS collects data on wages from outgoing rotation groups only, which represent one-quarter of the monthly sample. Self-employed workers are excluded from this subsample.
Statistical significance
Comparisons between estimates drawn from the CPS are tested for statistical significance using the “pweight” option in Stata. All tests for statistical significance are conducted using 99% confidence intervals. Replicate weights are not available for the monthly CPS files.


