This study calculates Religious Diversity Index (RDI) scores for countries, regions and the world based on the shares of eight major world religions (Buddhism, Christianity, folk or traditional religions, Hinduism, Islam, Judaism, other religions considered as a group, and the religiously unaffiliated). The methodology used by Pew Research to calculate the levels of religious diversity was developed by former senior researcher Brian J. Grim in consultation with other members of the Pew Research Center staff, building on a methodology that Grim developed with Todd M. Johnson, director of the Center for the Study of Global Christianity.9
The RDI is a version of the Herfindahl-Hirschman Index, which is used in various fields to measure the degree of concentration of human or biological populations as well as organizations. The main difference is that RDI scores are inverted so that higher scores indicate higher diversity.10
The Herfindahl-Hirschman Index is a widely accepted measure of concentration used by biologists, ecologists, linguists, economists, sociologists and demographers. For instance, the U.S. Department of Justice and the Federal Reserve Board use the Herfindahl-Hirschman Index to evaluate the competitive effects of mergers.11 A variant of the index was introduced as a measure to describe the diversity of ecological populations and was used in a variety of related studies, including measuring the diversity of languages spoken in a region.12 Starting in the 1960s, the index was used to measure population groups, including occupations and religions.13 Sociologists and other population researchers consider the Herfindahl-Hirschman Index a reliable measure to describe religious diversity.14
Although the Herfindahl-Hirschman Index is one of the most commonly used measures of diversity, there are other measures in use, including the raw number of different religions of a certain share or size in a country.15
Calculating the Religious Diversity Index (RDI)

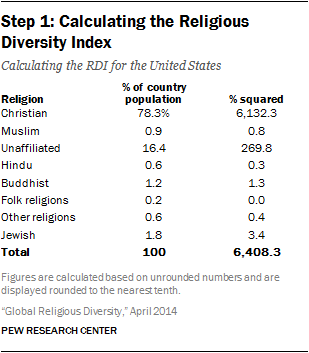
The Religious Diversity Index (RDI) is calculated using a three-step procedure. First, the shares of the eight major religious groups analyzed in this study are squared and summed. For example, in a case where the entire population belongs to one religious group, the first step results in a score of 10,000 (1002 = 10,000). By contrast, in a case where the population is equally distributed among the eight religious groups (12.5% each), the first step would result in a score of 1,250 (12.52 + 12.52 + 12.52 + 12.52 + 12.52 + 12.52 + 12.52 + 12.52 = 1,250). This first-step score of 1,250 represents maximum possible diversity when eight groups are considered. (See tables to the right and below for an example of calculating the RDI.)

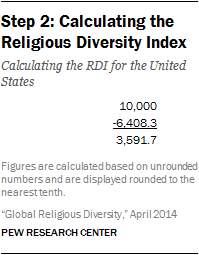
Second, the first-step score is inverted so that lower scores reflect lower religious diversity and higher scores reflect higher religious diversity. To invert the scores, the first-step score is subtracted from the score representing no religious diversity (10,000). In the case where the entire population belongs to one religious group, the score would now become 0 (10,000–10,000=0). In the case where the population is equally distributed among the eight religious groups, the score would now become 8,750 (10,000–1,250=8,750). This inverted second-step score of 8,750 now represents maximum possible diversity when eight groups are considered.

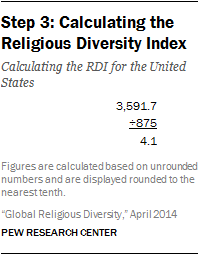
Third, the second-step score is divided by 875 to put the final Religious Diversity Index on a 0-10 scale. In the case where the entire population belongs to one religious group, the score would remain 0 (0/875=0). But in the case where the population is equally distributed among the eight major religious groups, the score would now become 10 (8,750/875=10).
Levels

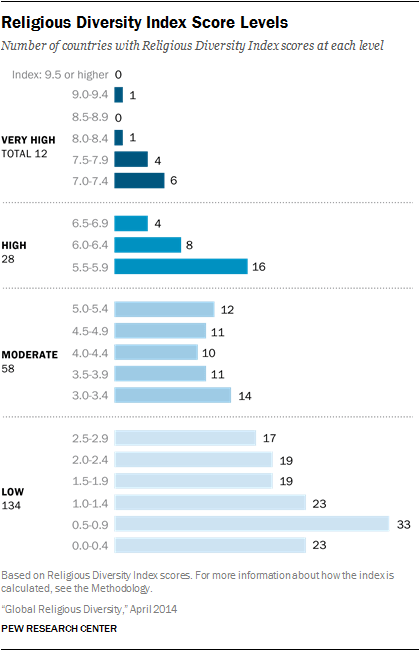
The Religious Diversity Index is divided into four ranges: very high (the top 5% of scores), high (the next highest 15% of scores, which works out to 16% because of tie scores), moderate (the next 20% of scores) and low (the bottom 59% of scores). Readers should note that since the RDI measures the level of religious diversity based on the shares of eight religious groups, there is no precise breakpoint for the levels based on the size of the largest group. Nevertheless, some generalizations are possible. In countries with very high diversity, the largest religious group usually makes up no more than 50% of the population and at least two other religious groups each account for 10% or more of the population. In countries with high religious diversity, the largest religious group generally accounts for less than 70% of the population and two or more groups account for most of the remainder. In countries with moderate religious diversity, the largest religion usually accounts for 70-85% of the population, while the remainder of the population tends to belong to one other religion. And in countries with low religious diversity, the largest group typically accounts for more than 85% of the population.
Data Sources
This new Pew Research study uses its estimates from the December 2012 report “The Global Religious Landscape: A Report on the Size and Distribution of the World’s Major Religious Groups as of 2010” to analyze religious diversity in 232 countries and territories for the year 2010. The study includes estimates for Christians, Muslims, the religiously unaffiliated, Hindus, Buddhists, folk religionists, adherents of other religions and Jews. Taken together, these eight major religious groups comprise the world’s total population.
As part of the Global Religious Landscape report, Pew Research staff acquired and analyzed religious composition information from about 2,500 data sources, including censuses, demographic surveys, general population surveys and other studies – the largest project of its kind to date.16 Censuses were the primary source for Pew Research’s religious composition estimates in 90 countries, which together cover 45% of all people in the world. Large-scale demographic surveys were the primary sources for an additional 43 countries, representing 12% of the global population. General population surveys were the primary source of data for an additional 42 countries, representing 37% of the global population.
Together, censuses or surveys provided estimates for 175 countries representing 95% of the world’s population. In the remaining 57 countries, representing 5% of the world’s population, the primary sources for the religious-composition estimates include population registers and institutional membership statistics reported in the World Religion Database and other sources.
The measure of religious identity in this study is sociological rather than theological. In order to have statistics that are comparable across countries, the study attempts to count individuals who self-identify with each religion. This includes people who hold beliefs that may be viewed as unorthodox or heretical by others who claim the same religion. It also includes people who do not regularly practice the behaviors prescribed by their religion, such as those who seldom pray or attend worship services.
For more information, see the Methodology of the Global Religious Landscape report. A list of the primary sources used to estimate the overall religious composition of each country is provided in Appendix B (PDF) of that report.
A Note on Geographic Spread and Segregation
Geographic distribution and/or segregation are important aspect of diversity. For instance, a recent analysis of census data indicates that even though racial diversity is increasing in the United States, it is rare to see highly diverse neighborhoods because segregation is still a common phenomenon.17 However, religious diversity at the subnational or neighborhood level is not estimated in this study primarily because of a lack of data at this level for almost every country in the world.
A Note on Regions
This report groups 232 countries and territories into six major regions: Asia and the Pacific, Europe, Latin America and the Caribbean, the Middle East and North Africa, North America and sub-Saharan Africa. Some previous Pew Research reports including “Global Christianity: A Report on the Size and Distribution of the World’s Christian Population” and “The Future of the Global Muslim Population” grouped the world into five regions, with an Americas region that included both North America and Latin America and the Caribbean.
The 60 countries and territories in the Asia and the Pacific region are: Afghanistan, American Samoa, Armenia, Australia, Azerbaijan, Bangladesh, Bhutan, Brunei, Burma (Myanmar), Cambodia, China, Cook Islands, Cyprus, Federated States of Micronesia, Fiji, French Polynesia, Guam, Hong Kong, India, Indonesia, Iran, Japan, Kazakhstan, Kiribati, Kyrgyzstan, Laos, Macau, Malaysia, Maldives, Marshall Islands, Mongolia, Nauru, Nepal, New Caledonia, New Zealand, Niue, North Korea, Northern Mariana Islands, Pakistan, Palau, Papua New Guinea, the Philippines, Samoa, Singapore, Solomon Islands, South Korea, Sri Lanka, Taiwan, Tajikistan, Thailand, Timor-Leste, Tokelau, Tonga, Turkey, Turkmenistan, Tuvalu, Uzbekistan, Vanuatu, Vietnam and Wallis and Futuna.
The 50 countries and territories in Europe are: Albania, Andorra, Austria, Belarus, Belgium, Bosnia-Herzegovina, Bulgaria, Channel Islands, Croatia, Czech Republic, Denmark, Estonia, Faeroe Islands, Finland, France, Georgia, Germany, Gibraltar, Greece, Hungary, Iceland, Ireland, Isle of Man, Italy, Kosovo, Latvia, Liechtenstein, Lithuania, Luxembourg, Malta, Moldova, Monaco, Montenegro, Netherlands, Norway, Poland, Portugal, Republic of Macedonia, Romania, Russia, San Marino, Serbia, Slovakia, Slovenia, Spain, Sweden, Switzerland, Ukraine, United Kingdom and Vatican City.
The 46 countries and territories in Latin America and the Caribbean are: Anguilla, Antigua and Barbuda, Argentina, Aruba, Bahamas, Barbados, Belize, Bolivia, Brazil, British Virgin Islands, Cayman Islands, Chile, Colombia, Costa Rica, Cuba, Dominica, Dominican Republic, Ecuador, El Salvador, Falkland Islands (Malvinas), French Guiana, Grenada, Guadeloupe, Guatemala, Guyana, Haiti, Honduras, Jamaica, Martinique, Mexico, Montserrat, Netherlands Antilles, Nicaragua, Panama, Paraguay, Peru, Puerto Rico, St. Kitts and Nevis, St. Lucia, St. Vincent and the Grenadines, Suriname, Trinidad and Tobago, Turks and Caicos Islands, U.S. Virgin Islands, Uruguay and Venezuela.
The 20 countries and territories of the Middle East and North Africa are: Algeria, Bahrain, Egypt, Iraq, Israel, Jordan, Kuwait, Lebanon, Libya, Morocco, Oman, the Palestinian territories, Qatar, Saudi Arabia, Sudan, Syria, Tunisia, United Arab Emirates, Western Sahara and Yemen.
The five countries and territories of North America are: Bermuda, Canada, Greenland, St. Pierre and Miquelon and the United States.
The 51 countries and territories of sub-Saharan Africa are: Angola, Benin, Botswana, Burkina Faso, Burundi, Cameroon, Cape Verde, Central African Republic, Chad, Comoros, Democratic Republic of the Congo, Djibouti, Equatorial Guinea, Eritrea, Ethiopia, Gabon, Gambia, Ghana, Guinea, Guinea-Bissau, Ivory Coast, Kenya, Lesotho, Liberia, Madagascar, Malawi, Mali, Mauritania, Mauritius, Mayotte, Mozambique, Namibia, Niger, Nigeria, Republic of the Congo, Reunion, Rwanda, Sao Tome and Principe, Senegal, Seychelles, Sierra Leone, Somalia, South Africa, South Sudan, St. Helena, Swaziland, Tanzania, Togo, Uganda, Zambia and Zimbabwe.


