Summary of Findings
Polarized Crowds: Political conversations on Twitter
Conversations on Twitter create networks with identifiable contours as people reply to and mention one another in their tweets. These conversational structures differ, depending on the subject and the people driving the conversation. Six structures are regularly observed: divided, unified, fragmented, clustered, and inward and outward hub and spoke structures. These are created as individuals choose whom to reply to or mention in their Twitter messages and the structures tell a story about the nature of the conversation.
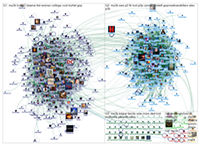
If a topic is political, it is common to see two separate, polarized crowds take shape. They form two distinct discussion groups that mostly do not interact with each other. Frequently these are recognizably liberal or conservative groups. The participants within each separate group commonly mention very different collections of website URLs and use distinct hashtags and words. The split is clearly evident in many highly controversial discussions: people in clusters that we identified as liberal used URLs for mainstream news websites, while groups we identified as conservative used links to conservative news websites and commentary sources. At the center of each group are discussion leaders, the prominent people who are widely replied to or mentioned in the discussion. In polarized discussions, each group links to a different set of influential people or organizations that can be found at the center of each conversation cluster.
While these polarized crowds are common in political conversations on Twitter, it is important to remember that the people who take the time to post and talk about political issues on Twitter are a special group. Unlike many other Twitter members, they pay attention to issues, politicians, and political news, so their conversations are not representative of the views of the full Twitterverse. Moreover, Twitter users are only 18% of internet users and 14% of the overall adult population. Their demographic profile is not reflective of the full population. Additionally, other work by the Pew Research Center has shown that tweeters’ reactions to events are often at odds with overall public opinion— sometimes being more liberal, but not always. Finally, forthcoming survey findings from Pew Research will explore the relatively modest size of the social networking population who exchange political content in their network.
Still, the structure of these Twitter conversations says something meaningful about political discourse these days and the tendency of politically active citizens to sort themselves into distinct partisan camps. Social networking maps of these conversations provide new insights because they combine analysis of the opinions people express on Twitter, the information sources they cite in their tweets, analysis of who is in the networks of the tweeters, and how big those networks are. And to the extent that these online conversations are followed by a broader audience, their impact may reach well beyond the participants themselves.
Our approach combines analysis of the size and structure of the network and its sub-groups with analysis of the words, hashtags and URLs people use. Each person who contributes to a Twitter conversation is located in a specific position in the web of relationships among all participants in the conversation. Some people occupy rare positions in the network that suggest that they have special importance and power in the conversation.
Social network maps of Twitter crowds and other collections of social media can be created with innovative data analysis tools that provide new insight into the landscape of social media. These maps highlight the people and topics that drive conversations and group behavior – insights that add to what can be learned from surveys or focus groups or even sentiment analysis of tweets. Maps of previously hidden landscapes of social media highlight the key people, groups, and topics being discussed.
Conversational archetypes on Twitter
The Polarized Crowd network structure is only one of several different ways that crowds and conversations can take shape on Twitter. There are at least six distinctive structures of social media crowds which form depending on the subject being discussed, the information sources being cited, the social networks of the people talking about the subject, and the leaders of the conversation. Each has a different social structure and shape: divided, unified, fragmented, clustered, and inward and outward hub and spokes.
After an analysis of many thousands of Twitter maps, we found six different kinds of network crowds.

Polarized Crowd: Polarized discussions feature two big and dense groups that have little connection between them. The topics being discussed are often highly divisive and heated political subjects. In fact, there is usually little conversation between these groups despite the fact that they are focused on the same topic. Polarized Crowds on Twitter are not arguing. They are ignoring one another while pointing to different web resources and using different hashtags.
Why this matters: It shows that partisan Twitter users rely on different information sources. While liberals link to many mainstream news sources, conservatives link to a different set of websites.

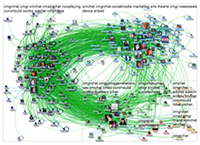
Tight Crowd: These discussions are characterized by highly interconnected people with few isolated participants. Many conferences, professional topics, hobby groups, and other subjects that attract communities take this Tight Crowd form.
Why this matters: These structures show how networked learning communities function and how sharing and mutual support can be facilitated by social media.

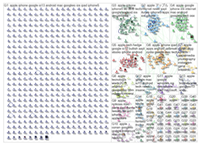
Brand Clusters: When well-known products or services or popular subjects like celebrities are discussed in Twitter, there is often commentary from many disconnected participants: These “isolates” participating in a conversation cluster are on the left side of the picture on the left). Well-known brands and other popular subjects can attract large fragmented Twitter populations who tweet about it but not to each other. The larger the population talking about a brand, the less likely it is that participants are connected to one another. Brand-mentioning participants focus on a topic, but tend not to connect to each other.
Why this matters: There are still institutions and topics that command mass interest. Often times, the Twitter chatter about these institutions and their messages is not among people connecting with each other. Rather, they are relaying or passing along the message of the institution or person and there is no extra exchange of ideas.

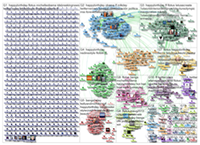
Community Clusters: Some popular topics may develop multiple smaller groups, which often form around a few hubs each with its own audience, influencers, and sources of information. These Community Clusters conversations look like bazaars with multiple centers of activity. Global news stories often attract coverage from many news outlets, each with its own following. That creates a collection of medium-sized groups—and a fair number of isolates (the left side of the picture above).
Why this matters: Some information sources and subjects ignite multiple conversations, each cultivating its own audience and community. These can illustrate diverse angles on a subject based on its relevance to different audiences, revealing a diversity of opinion and perspective on a social media topic.

Broadcast Network: Twitter commentary around breaking news stories and the output of well-known media outlets and pundits has a distinctive hub and spoke structure in which many people repeat what prominent news and media organizations tweet. The members of the Broadcast Network audience are often connected only to the hub news source, without connecting to one another. In some cases there are smaller subgroups of densely connected people— think of them as subject groupies—who do discuss the news with one another.
Why this matters: There are still powerful agenda setters and conversation starters in the new social media world. Enterprises and personalities with loyal followings can still have a large impact on the conversation.

Support Network: Customer complaints for a major business are often handled by a Twitter service account that attempts to resolve and manage customer issues around their products and services. This produces a hub and spoke structure that is different from the Broadcast Network pattern. In the Support Network structure, the hub account replies to many otherwise disconnected users, creating outward spokes. In contrast, in the Broadcast pattern, the hub gets replied to or retweeted by many disconnected people, creating inward spokes.
Why this matters: As government, businesses, and groups increasingly provide services and support via social media, support network structures become an important benchmark for evaluating the performance of these institutions. Customer support streams of advice and feedback can be measured in terms of efficiency and reach using social media network maps.
Why is it useful to map the social landscape this way?
Social media is increasingly home to civil society, the place where knowledge sharing, public discussions, debates, and disputes are carried out. As the new public square, social media conversations are as important to document as any other large public gathering. Network maps of public social media discussions in services like Twitter can provide insights into the role social media plays in our society. These maps are like aerial photographs of a crowd, showing the rough size and composition of a population. These maps can be augmented with on the ground interviews with crowd participants, collecting their words and interests. Insights from network analysis and visualization can complement survey or focus group research methods and can enhance sentiment analysis of the text of messages like tweets.
Like topographic maps of mountain ranges, network maps can also illustrate the points on the landscape that have the highest elevation. Some people occupy locations in networks that are analogous to positions of strategic importance on the physical landscape. Network measures of “centrality” can identify key people in influential locations in the discussion network, highlighting the people leading the conversation. The content these people create is often the most popular and widely repeated in these networks, reflecting the significant role these people play in social media discussions.
While the physical world has been mapped in great detail, the social media landscape remains mostly unknown. However, the tools and techniques for social media mapping are improving, allowing more analysts to get social media data, analyze it, and contribute to the collective construction of a more complete map of the social media world. A more complete map and understanding of the social media landscape will help interpret the trends, topics, and implications of these new communication technologies.
Method: Network mapping the social media landscape with NodeXL
These findings come from a collaboration between the Pew Research Center’s Internet Project and the Social Media Research Foundation. We used a free and open social media network analysis tool created by the Social Media Research Foundation called NodeXL1 to collect data from Twitter conversations and communities related to a range of topics. NodeXL then generated network visualization maps along with reports that highlighted key people, groups, and topics in the social media discussions.
Network maps are created by drawing lines between Twitter users that represent the connections they form when they follow, reply to, or mention one another. Structures emerge in network maps when all the linkages between Twitter users discussing a particular subject are plotted.
A taxonomy of six distinct types of conversations emerged from our analysis of thousands of social media network maps on a variety of topics. Our method for discovery was not to build network maps that matched a type; we did not start by believing that all politics-related structures had the same structure. Rather, we made many maps on many subjects and then observed the structures created by each topic. Observational analysis led us to recognize recurring structures in these social media networks. Once those network structures became apparent, we explored the kinds of topics and issues that created those network structures.
The distinctive structures observed are not comprehensive—social media is a large-scale phenomenon and the efforts to map it have just begun. But these six social media network structures can be considered archetypes because they occur regularly and cannot be reduced to one another. Additional structures are possible and may be discovered by on-going search. As tools get easier to use and the number of investigators grows, a more complete composite picture of the landscape of social media will likely emerge.
In practice, many social media topics exhibit a hybrid network structure that combines elements of the six network types described here. For instance, a Tight Crowd may also have a Broadcast hub. Or a Support Network may also attract a sparse collection of unconnected people talking about a product or brand. Any given social media network may feature elements of these six core types. But these examples illustrate distinct structural patterns that define distinct dimensions of the social media landscape.
Below in Figure 1 is an annotated version of the Polarized Crowd map collected and drawn by NodeXL. It highlights key features of this “aerial view” of this kind of social media crowd.
How to draw a Twitter social media network map

- 1 Boxes: NodeXL divides the network into groups (G1, G2, …) located in separate boxes and labeled by the top hashtags used in the tweets from the users in each group.
- 2 Pictures/Icons: Each Twitter user who posted on this subject in the time period is represented by their profile picture. The bigger the picture, the more followers the Twitter user has.
- 3 Bridges: Twitter users who have followers in multiple groups and pass along information between them.
- 4 Edge/Line: Each line represents a link between two Twitter users who follow, reply to, or mention one another. Inside a group the lines make a dense mass. Between groups, fewer people follow one another.
- 5 Groups and density: The Twitter users who follow, mention, or reply to one another bunch together. The thicker/denser the group, the more people inside it are connected to each other and the less connected they are to people outside their group.
- 6 Hubs: The closer a picture is to the center of the group, the more connected to other group members the Twitter user is. These are often “influential” users.
- 7 Circles: Represent tweets that do not mention or reply to another Twitter user.
- 8 Isolates and small groups: Relatively unconnected Twitter users who tweet about a subject but aren’t connected to others in the large groups who discuss the same topic.
Step 1: Used NodeXL Twitter data importer to collect tweets that contain selected keywords or hashtags. In this case the hashtag was “#my2K,” a hashtag created by the Obama Administration on Nov. 28, 2012 in the context of the budget conflict with the Republicans. It is intended to represent the estimated $2,000 in increased taxes an average household was potentially facing unless Congress acted.
Step 2: NodeXL analyzes the collection of Tweets that contained the keywords or hashtag looking for connections formed when one user mentions or replies to another user. The tweets are sometimes collected over a short time span sometimes over a period up to about week, depending on the popularity of the topic.
Step 3: NodeXL automatically analyzed the network and constructed groups created by an algorithm that places each person in a group based on how densely people tweeting about the topic were connected to each other.
Step 4: NodeXL draws the social network map with users represented by their profile photo, groups displayed in boxes, and lines drawn among the people who link to each other either by following, replying to, or mentioning one other.
What this all means
In the Polarized Crowd Twitter social media network map, two big groups of mostly disconnected people talk about the same subject but in very different ways and not to people in the other group. People in each group connect to different hub users. There are few bridges between the groups. This topic attracts two communities, with relatively few peripheral or isolated participants. Users in the two main groups make use of different URLs, words, and hashtags. See Part 2 for a detailed section on Polarized social media networks.
Influencers: Hubs and bridges in networks
Social media networks have an overall structure while the individual people within them have a local network structure based on their direct connections and the connections among their connections. Network maps show that each kind of social media crowd has a distinct structure of connection and influence. Key users occupy strategic locations in these networks, in positions like hubs and bridges.
Network maps can highlight key individual participants in Twitter conversation networks. There are several indicators of an individual’s importance in these network images. Each user is represented by her/his profile photo with a size proportionate to the number of other users who follow them. Some people have attracted large audiences for their content and are represented with a larger image. Some users in these conversation networks link to and receive links from far more Twitter users than most others. Network maps locate the key people who are at the center of their conversational networks – they are “hubs” and they are notable because their followers often retweet or repeat what they say. Some people have links across group boundaries – these users are called “bridges.” They play the important role of passing information from one group to another. These users are often necessary to cause a message to “go viral.”
NodeXL analyzes the content created by the people within each network and each subgroup within the network. Content is analyzed by examining the words, URLs, and hashtags that are most commonly used in the network and in each subgroup. Social media network crowds in each group have structures of content use with varying levels of overlap and diversity in contrast to their neighbor groups.
In the following we document in detail what happens in each kind of social media network crowd, highlighting the information attracting the most attention in the population, and the kinds of people and institutions that lead and shape the conversation.
Pairs of network types: Division, density, and direction
The network types we have identified group together in pairs based on their key properties. Networks can vary in terms of their internal divisions, density, and the direction of their connections. The first two network types are opposites of one another in terms of division or unity; the Polarized Crowd type is divided while the Tight Crowd network is unified. The next pair of network types, Brand Clusters and Community Clusters, have large populations of isolates, but vary in terms of the density of clustered connections. The Brand Cluster network structure has small disconnected groups with many isolated participants, while the Community Cluster network structure has larger, more connected groups along with many isolates. The last two networks are inversions of one another: the Broadcast Network features many spokes pointing inward to a hub while the Support Network structure features a hub linking outward to many spokes. Each of these network types is described in detail below.
Network metrics distinguish group types
Our initial six forms of social media networks can be more precisely defined in quantitative terms as relationships between different network measures – Figure 2 below.
Figure 2

Diagrams of the differences in the six types of social media networks would look like Figure 3:
Figure 3

A gallery of other social media network map examples
We have compiled network maps of other conversations illustrating each of the six different conversational structures on Twitter. It can be found here. Furthermore, since 2010, some of the regular users of NodeXL have posted their work and network data and visualizations to the NodeXL Graph Gallery website: http://nodexlgraphgallery.org/Pages/Default.aspx. NodeXL is an open source and free Excel add-in that can be downloaded from the site http://nodexl.codeplex.com. Readers are welcome to download the tool and the data sets we reference. The data sets are linked to copies on the NodeXL Graph Gallery site. We invite others to participate in contributing data and visualizations to the NodeXL Graph Gallery site and we would especially like to see and hear about network maps of other conversational archetypes.
