A short course explaining how public opinion polling works
Polling course overview
Hello! I’m Scott Keeter, senior survey advisor at Pew Research Center. I’ve been conducting surveys of all kinds for about 40 years. Currently I work with our survey methodology team, which provides methodological guidance and support to all the Center’s research teams.

Senior Survey Advisor
Pew Research Center
Most of the work we do at the Center involves opinion polling. So let’s take a step back and ask a few basic questions about this frequently misunderstood field:
- Lesson 1: Why do we have public opinion polls?
- Lesson 2: How does polling work?
- Lesson 3: What are the different kinds of polls?
- Lesson 4: What’s the deal with election polls?
- Lesson 5: Is accurate polling becoming harder to do?
- Lesson 6: What should you look for in a poll?
I’ll try to answer these and other questions in this course, which is made up of six short, easy-to-read lessons.
For centuries, scholars have debated the question: “What is public opinion?” Or, put differently, “What is the will of the people?” And for nearly as long, they have debated how best to measure it. The great political scientist V.O. Key Jr. defined public opinion as “those opinions held by private persons which governments find it prudent to heed.” And while there have been many ways of assessing and measuring these “opinions held by private persons” across the ages, by far the most common approach today is the opinion poll.
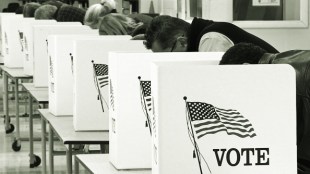
The typical opinion poll consists of a set of “interviews” with people selected to be representative of a population of interest, such as all U.S. adults. These aren’t like the anxiety-inducing interviews you might have for a job. In survey interviews, a pollster will ask everyone the same set of questions in the same way, then tally up the answers and report the results.
If the poll is designed properly, the responses collectively can describe the thinking and experiences of the much larger group of people the sample is chosen from. Our goal in this course is to demystify how this actually happens.
What’s on the syllabus?

In this course, we’ll try to give you a good introduction to opinion polling. We’ll talk about the kinds of polls being done and who is doing them. We’ll examine how polling works and answer questions like “How can a sample of just 1,000 people accurately represent the views of more than 260 million U.S. adults?”
We’ll also look at how polling has changed over the years, from a time when nearly all polls were conducted on people’s doorsteps, porches or in their living rooms, to today, when most people taking our polls are reading the questions on a smartphone and responding whenever it’s convenient for them.
To be sure, lots of pollsters – including us on occasion – still call people on the phone and ask them questions. And some of us still conduct paper-and-pencil surveys by mail. (Spoiler alert: We get better cooperation from potential respondents with our mail surveys than with any other method we use!)
We’ll also acknowledge that a lot of people – including maybe you – are wondering about those election polls. Election polling didn’t have a good year in 2020. But they rebounded in 2022, producing more accurate results. Nonetheless, polling in elections still faces many challenges. There is a lot to unpack about election polls, so we’ve devoted an entire lesson to this type of poll.
We’ll wrap up the course with a look at how you can become a good poll consumer. What can you do to make sure you’re getting reliable information? How do you know which polls to trust? And if you want to understand what the public thinks about a particular issue, what is the best way to use polls to inform yourself?
1. Why do we have opinion polls?
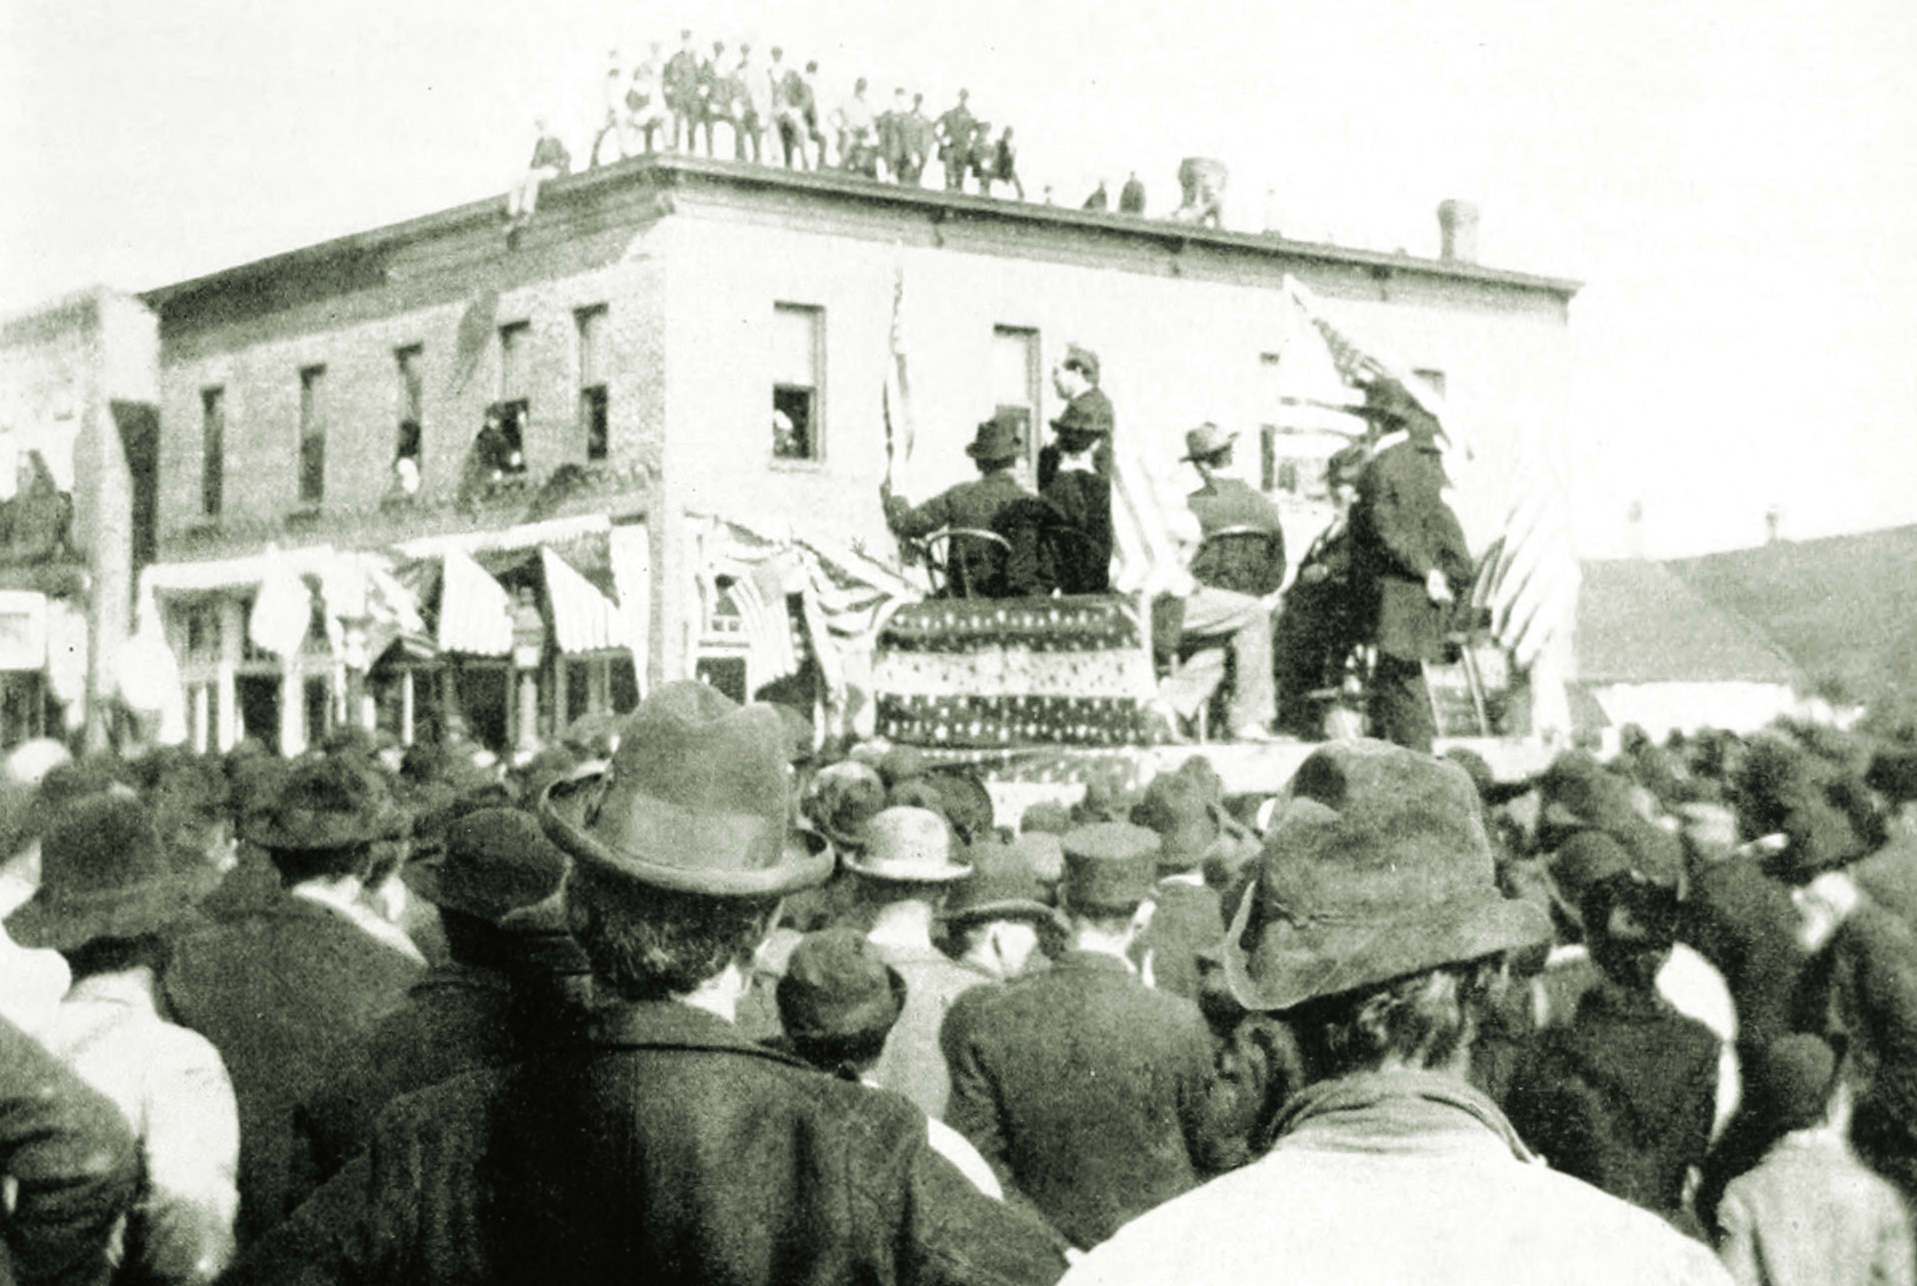
It turns out the word “poll” originally was a synonym for “head.” Polls counted heads at meetings or rallies to gauge popular sentiment, as in the 1870s political rally in Nebraska shown above. Today, we use polls to count heads, too – just a little more scientifically than under the old methods. Here at Pew Research Center, polling is the primary way we find out what the public knows, thinks and wants.
Don’t elections tell us what the public wants?
You might be asking yourself this question or thinking about all the other ways citizens communicate their opinions to officials, including through letters, phone calls, emails, texts, campaign contributions and even protests. All of those are indeed important ways that public opinion gets communicated, but each of them is limited in important ways.
Elections are very blunt. They don’t tell us why people supported a particular candidate or whether the public agrees with every policy the candidate proposed. And even with a high turnout election like 2020, a third or more of the public typically does not vote. How are their opinions accounted for?
Citizen communications to politicians, as well as more demonstrative activities like protests, can provide clearer guidance about how some people feel on certain topics. But only a minority of the public takes part in such activities, and those who do are hardly representative of the broader population. They tend to be more highly educated and more affluent than the average adult. Voters and those who contact public officials also tend to be older.
And one more thing: A lot of polling is conducted about topics other than those directly addressed by government. Elections do not readily answer broader questions about how people see the world – whether they believe in God, trust scientists or worry about misinformation, for example. Polls also ask about things other than opinions, such as financial circumstances, how people use technology and much more (stay tuned for Lesson 3).
How are opinion polls better?
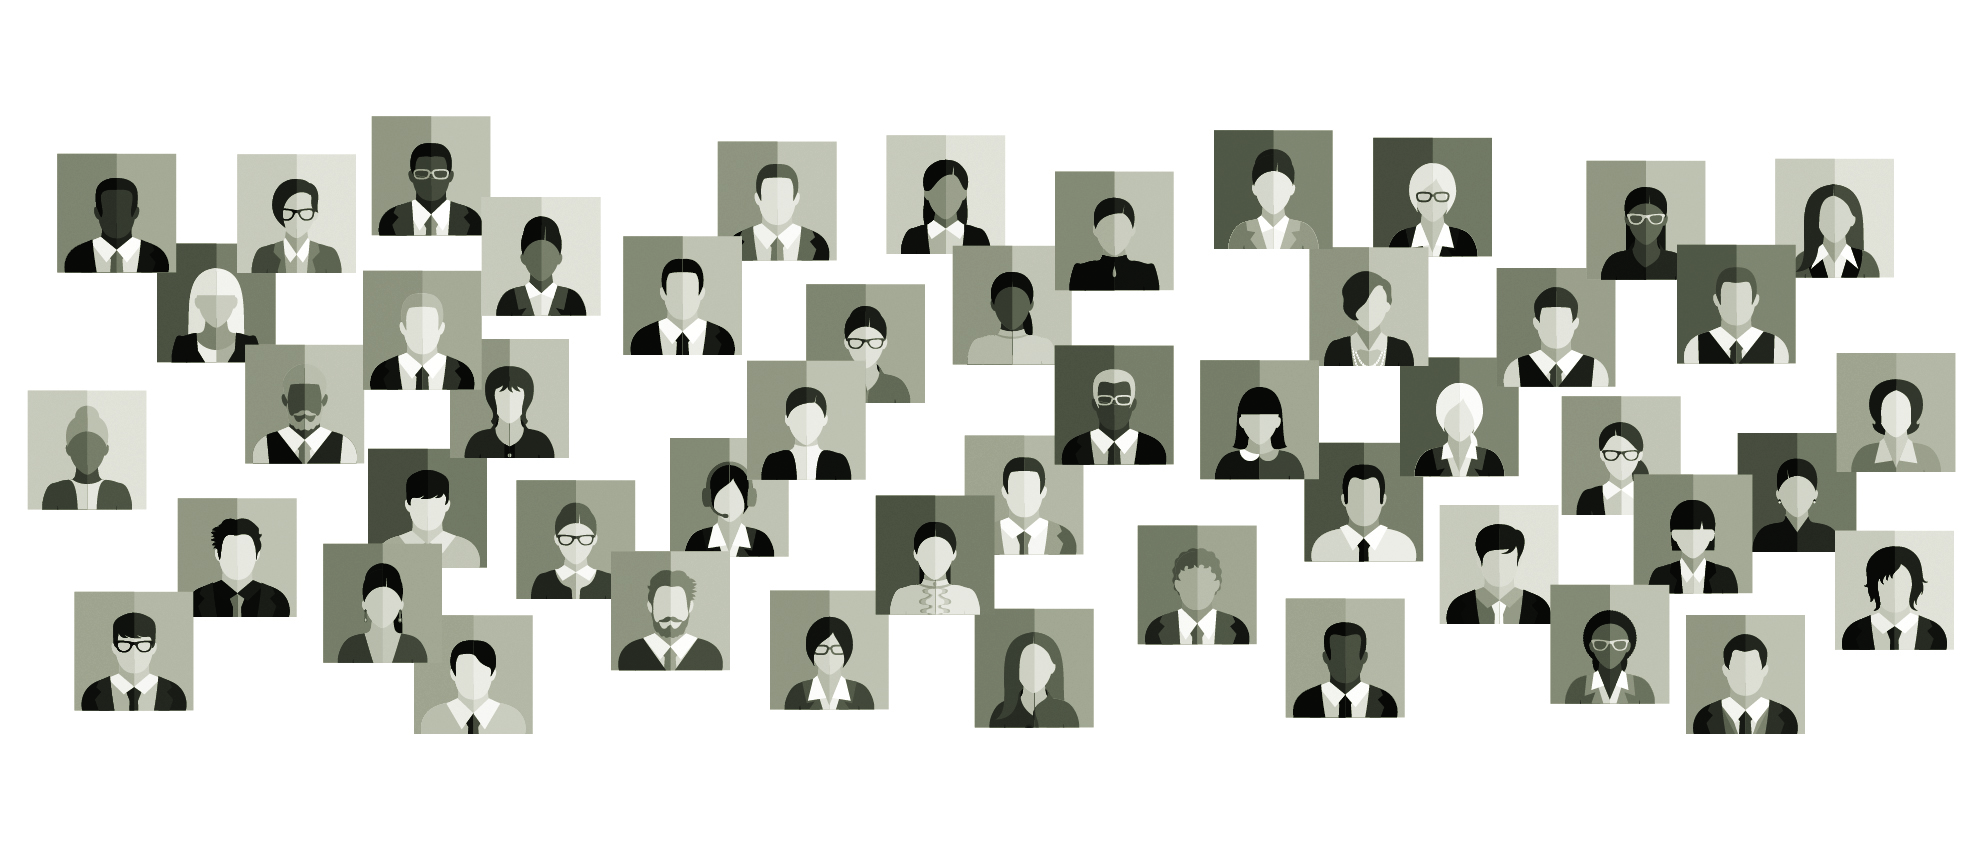
Rigorous opinion polls can overcome many of these limitations. The basic goal of a good public opinion poll is to give everyone in the population – regardless of their wealth, age, education, race, knowledge of politics or experience with it – an equal voice about the issues of the day.
We use a technique called random sampling to try to accomplish this. If it works properly, the sample we come up with for a survey can be assumed to be representative of the larger population on any question we might be interested in.
Random sampling matters because it makes sure that some voices aren’t louder than others. Here’s an example: Wealthier people are far more likely than others to donate to candidates running for office, and public officials hear these contributors loud and clear – even though they’re a small and unrepresentative slice of the entire population. But wealthy people are no more likely to be sampled for our polls than anyone else, so their voices don’t drown out the voices of others. (More on random sampling later in the course.)
What if we didn’t have polls?

Because polls can tell us things that are not available through any other method, they help serve as a check on those in power (and anyone else, for that matter) who might try to claim that they know what “the American people” think or want.
Without polls, we’d be back to an era of relying on so-called “man on the street” interviews – basically, a reporter going out and interviewing anyone available nearby. Such exercises can be interesting or fun, but they aren’t a reliable way of finding out what a diverse population really thinks.
Can’t polls do harm?
One criticism sometimes leveled at polls is that they may be affecting the very thing they are trying to measure. In elections, one version of this is that polls promote a bandwagon effect, in which voters see that a candidate is leading in the polls and decide to “get on the bandwagon” and support that candidate.
Another version is that polls showing one candidate with a comfortable lead may cause some voters to decide not to vote at all, on the logic that they are unlikely to affect the outcome. Neither of these situations is a good thing for a healthy democratic process!
Some countries have banned the publication of polls close to Election Day because of such concerns. But the evidence for these kinds of effects is mixed and complicated. And pollsters argue that polling data – whether in elections or just when issues are being debated – is just another source of information that people have a right to see and incorporate into their decision-making. Having a realistic view of what other people think might even turn down the heat on partisan polarization.
Extra credit
Want to learn even more about the world of survey research? Take a look at some of the resources below from the American Association for Public Opinion Research (AAPOR), the leading association of public opinion and survey research professionals in the U.S.
2. How does polling work?
The general goal of a poll is to describe or explain something about a population of interest (for example, the general public or registered voters) by asking questions of a small number of people who represent that larger population.
Conducting a poll requires three things:
- a set of questions to ask (a questionnaire)
- a set of people to interview (a sample)
- some way of connecting the two (sometimes called the mode of interview).
Once you’ve conducted the interviews, you have to tally up the data and summarize the results in a way that accurately reflects what your respondents told you.
Probably the most common question we get from our readers is “How do you choose who to interview?” We have sharp readers! How a poll samples people for inclusion is the single most important factor determining how accurate the poll will be. We’ll talk about this in detail below.
But it’s important to note that the choice of a sampling method often determines what mode of interview is best. For example, if we sample telephone numbers, the obvious mode choice is a telephone survey. If we sample addresses, we can conduct either a mail survey or an in-person survey.
All of this is a bit of a simplification, of course, but the essence of conducting a good poll is doing the best possible job with these three things: the mode, the sample and the questionnaire.
The mode of interview
Most of the first polls back in the 1930s and ’40s involved interviewers knocking on doors and asking questions of the people who happened to be at home. This kind of personal interviewing was a common method until the 1980s, though it’s very expensive and rarely used today in the U.S.
Paper-and-pencil surveys, often delivered by mail, were popular and remain a staple of the polling world today. Telephone interviewing became widespread in the 1980s and constituted much of the polling done over the following decades.
But the rise of the internet added a new way to interview people. Today, web surveys account for the majority of all polling because they are faster and – because an interviewer is not needed – much less expensive. Typically, people are initially contacted by phone, mail or email and then invited to take a survey on the web.

Each method or mode of interview has strengths and weaknesses. Using a live interviewer can help persuade people to participate and keep the interview focused.
But the presence of an interviewer can also affect how people respond. Self-administered surveys, like those done on paper or online, may yield more honest and accurate answers and allow people to respond whenever it’s convenient for them. They help reduce what’s called social desirability bias, a tendency of people to answer in a way that leaves a favorable impression – for instance, saying they voted even if they didn’t.
Regardless of mode, the goal is always for all respondents to have the same experience and answer freely and thoughtfully. One of the interesting trends in polling today is the rise of multimode surveys – polls that use more than one method of reaching people or that give those sampled the option of responding in more than one way.
The sample
If you field a poll only among your family, friends and co-workers, you may get interesting results, but you wouldn’t be able to generalize the results to people you don’t know. The people in your social, religious and work circles are likely to be similar to each other – and to you – in ways that matter for their opinions and experiences. For that reason, a good poll needs a sample that includes lots of different kinds of people.
The best way to get that diversity is through something called random sampling, a method that gives everybody in your population of interest an equal (or at least a known) chance of being included.
How does that work? Typical random sampling approaches include calling a random selection of telephone numbers (including cellphone numbers) or mailing a survey to a random sample of addresses.
Random phone numbers can be generated from a known set of area codes, exchanges and local groups of numbers that have been assigned to people or households. The U.S. Postal Service, meanwhile, maintains a list of all residential addresses in the U.S. These two approaches give nearly every American a chance to be polled.
Random sampling isn’t perfect. Not everyone who is sampled for the survey can be contacted. And in a typical poll, most who are contacted don’t agree to be interviewed. There are also some differences between those who are contacted and participate in a poll and those who don’t. But pollsters can correct for this problem using a technique called weighting.
How weighting works
Weighting boosts the voices of people who belong to groups that are less likely to participate in polls and lowers the voices of people from groups that are more likely to take polls.
For example, people who don’t have a college degree are less likely than college graduates to participate in polls, so those who do participate are “weighted up” to match their actual share of the population. On the other hand, people who engage in volunteer activities tend to be more likely to participate in polls, so their responses are “weighted down” to accurately reflect their share of the population in the final result.
Pollsters rely on knowledge about the population from the U.S. census or other sources to guide their decisions on weighting. It’s important to remember that the goal of weighting is to ensure that the voices of different groups are accurately represented in a poll’s results – and that the overall result accurately represents the views of the U.S. population as a whole.
If it sounds complicated, it is. It’s one of the more complex things pollsters do.
Opt-in sampling
A lot of the polls you might see these days don’t even use random sampling. Instead, they rely on various techniques to get people online to volunteer (or opt in) to take surveys, often in exchange for small rewards like gift cards. As a group, opt-in surveys are less accurate than those that use random sampling. This is especially true for estimates for young adults, Hispanics and other minority groups.
Opt-in polls make up a big share of the market research world and were used by a sizable share of organizations doing presidential polling in 2020.
How is it possible for these polls to accurately represent the population? One common way is through weighting – the same process used with random samples. But in the case of opt-in surveys, we don’t have the benefit of knowing that all kinds of people and groups in the population had a chance to be included, so there’s a much greater burden on weighting to make the sample match the population. Unfortunately, some of these opt-in surveys use very rudimentary approaches to weighting, which are less effective in making them representative.
A big hazard in opt-in samples: Bogus respondents
Opt-in surveys are also vulnerable to contamination from bogus respondents – people who are ineligible for the survey or who provide insincere responses.
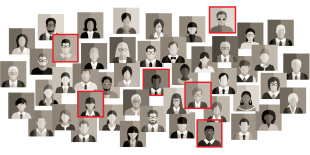
An improbable finding from a December 2023 opt-in survey looked like an example of this. The prominent survey found that 20% of adults under 30 strongly or somewhat agreed that “the Holocaust is a myth,” an implausible result given earlier polling on the subject. Pew Research Center repeated the question on its probability-based panel and found that only 3% of adults under 30 agreed with this inflammatory statement.
Not only did young adults stand out in the opt-in poll, 12% of Hispanics also agreed with the controversial statement about the Holocaust. Our research suggests that some people who engage in insincere responding (such as answering “yes” to every question) are claiming identities that they believe will give them access to more surveys and rewards. That is, they say they are Hispanic or young – but aren’t really.
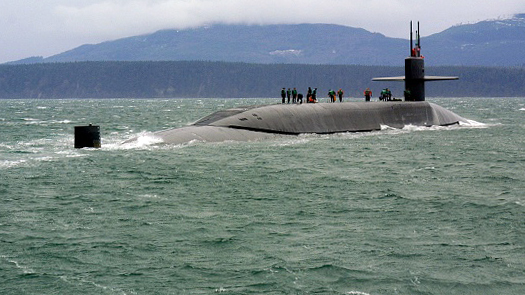
To help us observe this phenomenon in practice, we asked an opt-in sample to tell us whether they were licensed to drive a nuclear submarine, a qualification held by very few Americans. (While the exact number of submarine operators is unavailable, the entire U.S. Navy constitutes less than 0.2% of the adult population.) Among adults under 30 in this opt-in sample, 12% said yes. Among those claiming to be Hispanic, 24% said yes – versus 2% of non-Hispanics.
Of course, a zany question like this may inspire some silly answers. But we see similarly implausible results in opt-in surveys for more mundane questions like the receipt of certain government benefits, so the problem isn’t confined to topics like nuclear subs.
The questionnaire
The heart of a good poll is the set of questions to be asked. Seems simple, right? After all, we ask and answer questions all day long when talking with other people.
But we also know that misunderstandings are common in human conversations. So it’s important that poll questions are relatively simple, clear and understandable by people from a wide variety of backgrounds. (Check out our five-minute Methods 101 video on writing good survey questions.)
It’s also important to ask questions that people can answer. While that may seem obvious, you might be surprised by how many polls ask people about topics they’ve never thought about or know little about. Polls also sometimes ask people to remember details about things they’ve done in the past that hardly anyone could be expected to recall accurately.
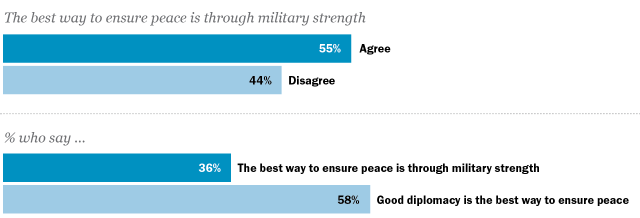
Another concern is that polling questions can intentionally or unintentionally lead people to answer in a particular way, just by the way they are posed. For example, asking people whether they agree or disagree with a statement usually gets more agreement than if the statement is paired with an alternative point of view.
A 55% majority in 1994 agreed with the statement “The best way to ensure peace is through military strength.” But posed against an alternative view – “Good diplomacy is the best way to ensure peace” – just 36% in another poll conducted at the same time endorsed “peace through military strength.”
Don’t be too suspicious about this, though. Most public pollsters are trying to get a fair reading of people’s opinions. And as a consumer of polls, you can do a pretty good job of evaluating the fairness of questions by consulting the full text of the question wording (sometimes called a topline). Read the question aloud: If it sounds loaded to you, it probably is. And if the full text of the questionnaire isn’t made available, you should be skeptical about the poll.
At Pew Research Center, we make all our questionnaires publicly available. Here’s an example (PDF).
Throughout the process of conducting a poll, we try to be mindful that our respondents, collectively, give us hundreds of hours of their time when they read our survey questions and provide their answers. We are grateful and honored that people trust us with their views, so it’s important that we get it right when we tell the world what those views are. That’s what good pollsters do.
Extra credit
Our Methods 101 video series explains the basic methods we use to conduct our survey research. Here’s a playlist of short videos for you to watch at your leisure.
- How can a survey of 1,000 people tell you what the whole U.S. thinks?
- How do you write survey questions that accurately measure public opinion?
- How does the way a poll is conducted influence the answers people give?
- What are nonprobability surveys?
- How is polling done around the world?
3. What are the different kinds of polls?

The term “poll” is usually applied to a survey designed to measure people’s opinions. But not all surveys examine opinions. In fact, even our opinion polls often include questions about people’s experiences, habits or future intentions. Let’s look at the variety of ways surveys are used.
The decennial census and other government surveys in the U.S.
If you’re like most Americans, at some point in 2020 you probably responded to a survey conducted by the U.S. Census Bureau, asking questions about the people living in your household. This is the decennial census, a survey mandated by the U.S. Constitution to count the nation’s entire population every 10 years. (Preparations for the 2030 census are already well underway!)

While the mammoth effort to count the population may be its most visible and challenging activity, the Census Bureau also conducts numerous other large surveys for specific purposes. These include surveys to measure crime victimization, how Americans spend their time, the health of the U.S. population and even “Fishing, Hunting and Wildlife-Associated Recreation” (PDF).
These government surveys typically get very high levels of cooperation from the public and are trusted by officials to provide important data to guide policymaking. At Pew Research Center, we also use them as benchmarks to help ensure the accuracy of our own polls.
Polls about issues
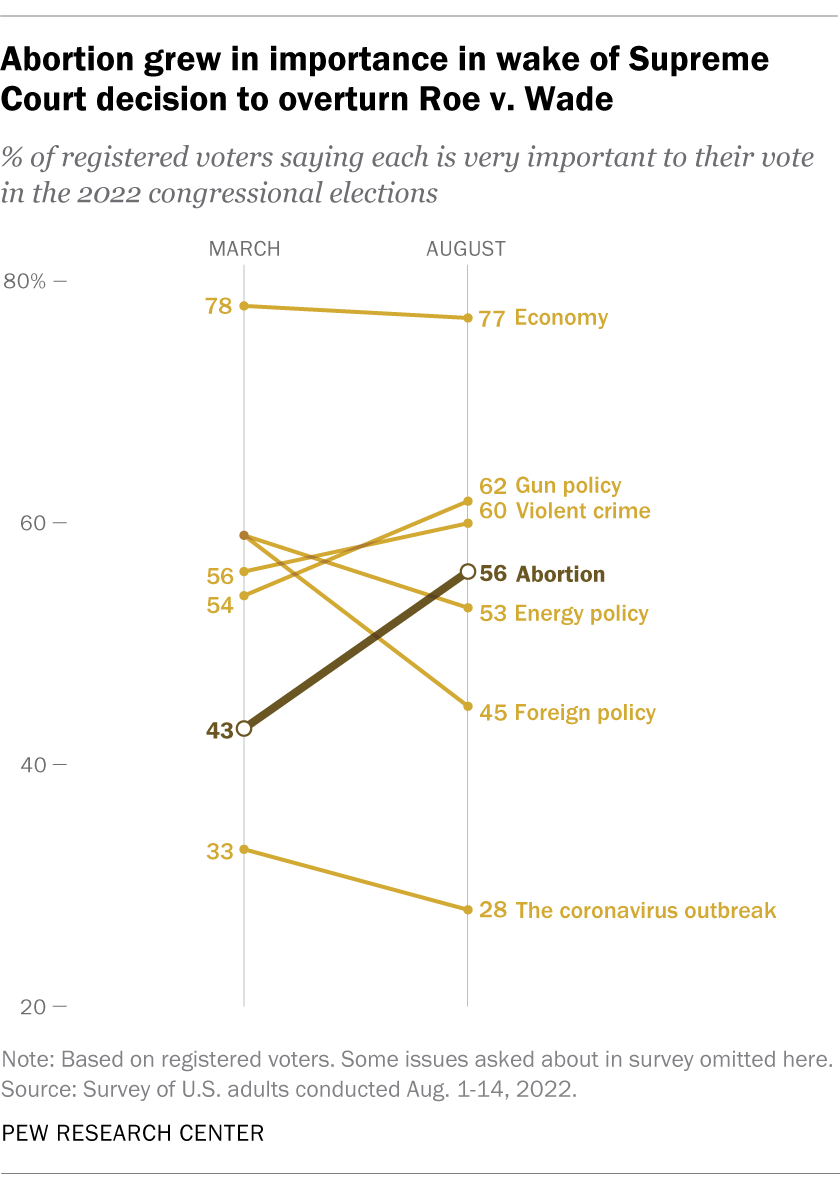
Issue polling – our bread and butter here at the Center – is focused on opinions and experiences: what people know about an issue, how it affects them, how important they think it is and what they think should be done about it. Abortion politics provides a good example.
Since the Supreme Court’s 2022 decision in Dobbs v. Jackson Women’s Health Organization, Pew Research Center polling has found no dramatic shift in overall opinion about whether abortion should be legal. But we have documented a sharp rise in the importance of the issue.
In an August 2022 poll, the share of registered voters who said that abortion would be very important to their midterm election vote reached 56%, up from 43% in March 2022, with virtually all of the change occurring among Democrats.
Abortion’s rise in importance as a voting issue aligns with efforts in multiple states to put constitutional amendments protecting abortion rights on the ballot for voters. In the two years after the Dobbs decision, in fact, all efforts to add protections for abortion rights were successful in the states where they were placed on the ballot.
Market research surveys

Businesses often conduct surveys to help them better understand consumer sentiment and preferences. While you may never have been included in an opinion poll about national policies or politics, you almost certainly have been asked by a retail store, auto repair shop, hospital, restaurant or other establishment to rate the quality of their products or services.
A great deal of market-related survey research is done to help businesses predict demand for new and existing products or services. Among many other things, surveys like these are used to measure the size and characteristics of the audience for television and radio programming and to gauge how people are reacting to newly released movies.
Election polls
There is one other kind of poll we haven’t mentioned yet: election polls. They are undoubtedly the most visible of all polls. Hundreds of them are conducted in a typical presidential election year, and they attract an enormous amount of attention. The credibility of all polling depends in large part on how election polls perform. For that reason, Lesson 4 will be devoted entirely to election polls!
Measuring public opinion without surveys
Of course, it’s also possible to get some sense of public sentiment without doing a survey. For more than a century, journalists and scholars have tried to understand election data by closely examining how voting patterns relate to the characteristics of the people living in particular locations, such as ethnic enclaves.
And despite polling’s difficulty in getting people to share their opinions in interviews, tens of millions of Americans are willing to express their views on social media sites like Facebook, X (formerly known as Twitter), Instagram and others. Political scientists have begun extracting information about public attitudes (PDF) from these sources, too. Studies have also focused on deriving evidence of attitudes, such as racial animosity, from an analysis of Google searches.
But as exciting as these new methods may be, a variety of challenges have hindered the development of such methods as a potential replacement for surveys.
One of the most common ways of probing public opinion that doesn’t involve a scientific survey is through in-depth interviews and focus groups. It’s probably obvious that you can learn a lot from talking with someone in an open-ended format: what words mean to people, why they have a particular belief, how strongly they feel about an issue. These are all potentially easier to explore in a conversation than a typical polling questionnaire.
Similarly, getting a small group of people together to talk about issues can reveal some truths that individual interviews might not. Ideally, these “focus groups” can give people a chance to openly share their perceptions, hopes, fears and ideas.
In-depth interviews and focus groups often help researchers decide to take on new topics for study that arose in the groups, and to write good questions about new topics.
Extra credit
Want to learn even more? Here’s a Pew Research Center reading list:
- What to know about the 2020 census
- How asking about your sleep, smoking or yoga habits can help pollsters verify their findings
- Does public opinion polling about issues still work?
- Polls on COVID-19 vaccination closely align with CDC data
4. What’s the deal with election polls?

An election poll is pretty much what it sounds like: a poll conducted before (or sometimes after) an election that focuses on the election. You’ll often hear about election polls when they’re being cited to show who’s ahead and who’s behind in the race – the “horse race.”
Though it often attracts the most attention, discovering the level of support each candidate has – or even forecasting the outcome of the election – isn’t the most important reason election polls are conducted.
What are election polls used for?
Election polls are particularly useful for understanding the meaning of the election. Polls can help clarify what voters – and nonvoters – are saying with their actions.
Here’s a short list of how election polls are used:
- They help us identify what kinds of people are voting for which candidate.
- They help explain the issues and concerns that may be leading to a choice for a particular candidate.
- They provide insight into why some people vote and others do not, including differences in engagement and interest between supporters of each candidate.
- They reveal how, when and where people cast their ballots – for example, whether it’s on Election Day or early, or by mail or in person.
- They describe how satisfied people are with their choice of candidates, for instance, or whether they find a campaign informative.
- They can tell us how the public judges the election process and reacts to the outcome of the election.
- For those involved in election campaigns, polls can also provide important strategic information: where and when to campaign, which groups to try to appeal to, which messages are likely to work.
How are election polls conducted?
The quick answer is … just like other polls.
Like all polls, election polls have to gather an accurate sample of the population and an accurate measurement of the subjects of interest. To achieve this accuracy, election polling has evolved just like other polling has.
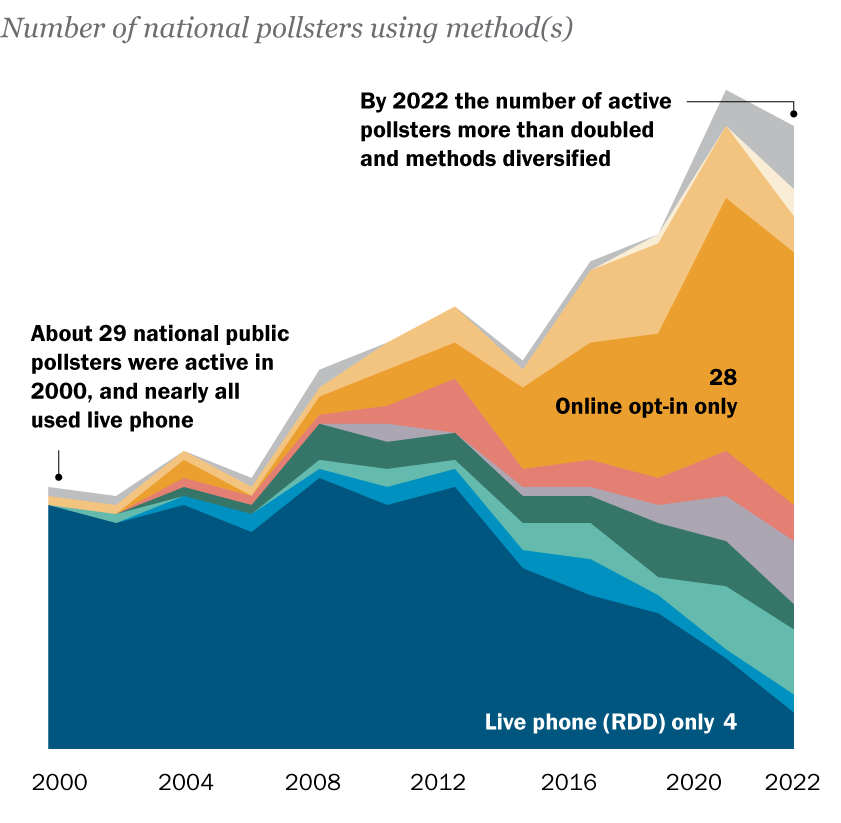
We tracked the methods used by polling organizations in election years between 2000 and 2022 and found that online election polling – especially with opt-in sampling – grew rapidly after 2008 and is now widespread. Live interviewer telephone polling, on the other hand, dwindled after 2012.
Beyond the growth of online opt-in polling, a couple of other things are apparent in this colorful chart. One is growth in the sheer number of pollsters conducting national election polls – more than twice as many in 2022 as in 2000. Cheap opt-in methods have allowed a lot more people to claim the title of “pollster.” The other thing that stands out is growth in the diversity of methods now in use. Pollsters are trying out lots of approaches!
What’s different about election polls?
There is one thing that’s unique about preelection polls. Because most of them purport to describe the views of the people who will actually vote, rather than the general public, they have to determine which people among those interviewed will actually turn out. This is not an easy task.

Even with voter turnout in 2020 that eclipsed 100-year records, a third of the U.S. eligible adult population did not cast a ballot. Not everyone who says in a poll that they intend to vote actually does, and some people who tell a pollster they don’t plan to vote ultimately do.
Furthermore, as a group, nonvoters and irregular voters often differ from regular voters in terms of which candidate they prefer. Figuring out who will really vote can make a difference in what the poll finds about, say, the composition of the voting public. That may be a particularly hard job in a high-turnout election, when people who haven’t voted in the recent past suddenly show up, confounding pollster estimates.
Are election polls accurate?
You might be surprised to hear that election polling in the U.S. and around the world has a good track record for accuracy. A comprehensive study found that polls taken shortly before an election had an average error of less than 2 percentage points in estimates of support for a given party or candidate. But preelection polling was less accurate in the 2016 and 2020 presidential elections than it had been in the previous several contests, overstating support for Democratic candidates. Historically, polling errors have sometimes favored Democrats and sometimes Republicans, with no clear tendency.
The errors in 2016 mostly affected state polls, but many of the errors were in critical battleground states that contributed to Donald Trump winning the presidency. National polling that year was quite accurate, but quantitative forecasts of the election – some of which gave Hillary Clinton a greater than 90% chance of winning – may have undermined public confidence in the polls by leading many observers to believe the outcome was far more certain than the polls actually indicated.
Despite efforts to correct the problems of 2016, even larger errors affected both the state and national polls in 2020.
Pollsters scrambled to improve their methods and in 2022 produced much more accurate results in key state elections. But fears remain that presidential polling may again struggle to adequately represent support for Trump.
Because – fairly or unfairly – the outcome of elections is used to judge the accuracy of polling, it’s useful to understand the size of the errors we are talking about. According to the American Association for Public Opinion Research (or AAPOR, the professional association for the survey research field), national polls in 2020, on average, overstated Joe Biden’s margin over Trump by 3.9 percentage points, the largest such error since 1980. Even though his support was overstated in the polls, Biden won the election, so the polling errors were not as obvious as in 2016. But with a public closely divided between the two political parties, it’s especially crucial for the polling community to minimize the size of the errors.
At the same time, it’s important for polling consumers (that’s you!) to understand polling’s limitations. The margin of error you may have heard about is often as big as or bigger than the difference in support between two candidates in a close race. And the traditional margin of error doesn’t capture all of the sources of error affecting polls.
Extra credit
Want to learn even more? Here’s a reading list:
- The Death Of Polling Is Greatly Exaggerated (FiveThirtyEight)
- Can Likely Voter Models Be Improved? (Pew Research Center)
- Q&A: A conversation about U.S. election polling problems in 2020 (Pew Research Center)
- What 2020’s Election Poll Errors Tell Us About the Accuracy of Issue Polling (Pew Research Center)
5. Is accurate polling becoming harder to do?

Polls received a lot of criticism after the 2020 U.S. general election. Polls showed Joe Biden leading Donald Trump throughout the fall campaign season. He did win the election, but not by as large a margin or in as many states as the polls led people to expect.
The polling profession is making progress in understanding what went wrong in 2020. But the obstacles facing polling have been growing steadily over the past few decades, and election polls face unique challenges, including having to anticipate who is actually going to vote. These obstacles have required pollsters of all kinds to adjust their methods and devote considerably more effort to obtain accurate results.
It’s getting harder to reach people and persuade them to participate in a poll
The biggest obstacle surveys face today is that it has gotten much harder to reach people and persuade them to consent to an interview. This is mostly a consequence of lifestyle changes – people seem to have busier lives – coupled with a growing wariness about answering calls from unknown numbers or cooperating with requests for information from a person or organization they are not familiar with.
The nature of the problem is evident in the chart below, which shows Pew Research Center’s telephone survey response rates over the past 25 years or so. (The response rate is an estimate of the share of households we try to reach that ultimately complete an interview.)
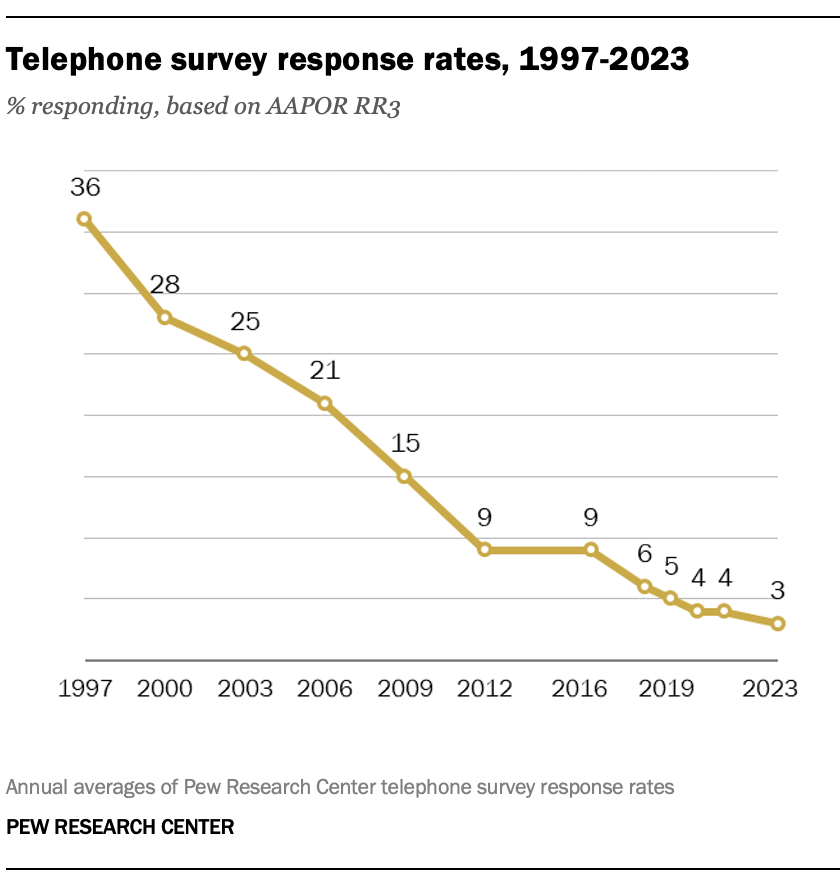
In part because of this decline in telephone response rates, Pew Research Center decided a few years back to stop relying primarily on telephone surveys and instead switch to using rigorous online surveys.
While telephone surveys can still provide accurate data, online surveys provide some advantages that make them an attractive alternative. Research has shown, for example, that the quality of answers people give in self-administered surveys is often higher than in surveys with an interviewer. And not needing interviewers means online surveys are usually less expensive than telephone surveys, sometimes significantly so.
That said, online surveys aren’t immune to the problems faced by other kinds of surveys. In the 2020 election, no type of survey stood out as especially more accurate than the others, and all kinds of surveys had problems.
Some people are more likely than others to take polls
As we noted in Lesson 2, another challenge for pollsters – especially election pollsters – is that people with higher levels of education tend to be more willing to participate in surveys, resulting in samples that overrepresent those with college degrees (i.e., more people in your sample have a degree than would if the selection were truly random).

The same is true for people with higher incomes. And perhaps not surprisingly, people who are engaged with politics and public affairs are more willing to take polls that deal with these subjects.
Fortunately, data from the U.S. census can serve as a benchmark to ensure that survey samples match the total U.S. population on characteristics like education, age and voter registration. Using this information, we’re able to give greater weight to underrepresented groups in the sample so their voice matches their share in the population.
Other problems can’t be fixed by consulting census data. In 2020, for example, there was a general tendency for Biden supporters to be more likely than Trump supporters to cooperate with polling requests, according to a review of 2020 election polls by the American Association for Public Opinion Research (AAPOR), the major professional association of U.S. pollsters.
Election polling in the U.S. and around the world has been quite accurate for decades because supporters of different parties and candidates have seemed equally willing (or unwilling) to participate. Right now, we can’t know whether this is a short-term issue or something polls will have to deal with going forward.
So, can we still trust polls?
It’s important to put the 2020 performance of election polls into perspective. The errors were consequential, to be sure, and very sizable compared with most election polls. But they were not particularly large in absolute terms – just a few percentage points, on average, on each candidate’s support.
It’s also crucial to understand that most polls are not about elections. Instead, they aim to capture people’s views on the key issues of the day, the realities of their lives, such as their employment, lifestyle activities or health care, where they get their information, and other subjects.
This kind of polling is important because it provides an independent source of information about what Americans experience and what they believe – without which we’d be left with whatever pundits, parties and public officials claim the public is thinking.

Fortunately, the news is better when it comes to this type of issue polling. We have a lot of evidence that polls that are weighted to match the population on important demographic categories do a good job.
And when it comes to issue polling, errors in accurately representing the share of Biden or Trump voters make very little difference in the results. For example, small errors in candidate support are less meaningful when trying to understand how people feel about abortion, the budget deficit, foreign aid, climate change or other issues. Plus, just because someone supports a certain candidate doesn’t mean they agree with that candidate on every issue.
In sum, pollsters recognize the challenges they are facing and are working hard to ensure that their work continues to accurately represent the views of the public. One way this is happening is through the growth of different ways of doing polls, some of which may be less reliable than others. Experimentation is a good thing, but it makes the job of a poll consumer – you – much harder. Our last lesson will focus on how you can become a more astute reader of the polls.
Extra credit
Want to learn even more? Here’s a reading list:
- Q&A: What is the American Trends Panel, and how has it changed? (Pew Research Center)
- 2020 Pre-Election Polling: An Evaluation of the 2020 General Election Polls (AAPOR)
- The Polls Were Historically Accurate in 2022 (FiveThirtyEight)
- Your guide to the chaotic 2024 polling year ahead (Politico)
6. What should you look for in a poll?

If it’s true that “you are what you eat,” then it’s also true that what you know about public opinion depends on your diet of polls.
When nutritionists tell you to “eat right,” they usually mean that you should eat high-quality foods and have a balanced diet. Same with polls: Try to consume high-quality polling and limit your intake of junk polls. And if you want to better understand a topic, look at a variety of survey questions about it.
How do I know what’s high-quality polling?
The easiest way is to rely on polling from organizations with a track record in survey research, like Pew Research Center or Gallup (you knew I’d say that, didn’t you?). Major media organizations like Fox News, CNN, NBC, CBS, ABC and The Washington Post also have dedicated teams that conduct regular, high-quality polling on the issues of the day, as well as about elections.

Many private survey companies and university research centers do polling of their own, sometimes in partnership with news organizations (for example, SSRS and CNN, NORC and The Associated Press or Siena College and The New York Times). Other universities that conduct polls include Monmouth, Quinnipiac and Marist. Of course, just because you haven’t heard of a particular polling organization doesn’t necessarily mean its results are wrong.
Critics of polling sometimes say that polls are designed to promote a particular point of view. While it’s always possible to find a poll or individual question that might be biased, there are at least two reasons to be skeptical that intentional bias is widespread in public polling.
First, all the organizations mentioned above – and others – have been around and doing polling for many years. They have reputations to protect, both among their audiences and among their peers in the polling community. (And believe me, we carefully watch what our peers do and vice versa.) If a particular poll publishes a questionable result, another polling organization will sometimes conduct a similar poll to see if it can confirm the result.
Second, you can usually make a reasonable assessment of the trustworthiness of a poll yourself. A reputable polling organization will make available some basic information about how the poll was conducted, how the questions were asked and what questions were asked. If the organization won’t provide that information, you shouldn’t trust its polls. (The major association of polling professionals, the American Association for Public Opinion Research, or AAPOR, has a list of polling organizations that have committed to transparency.)
OK, I’ve found some info about how a poll was done. But what exactly am I looking for?

There should be a methodology statement and a list of the questions asked, which, along with the description of the findings, should enable you to answer questions like these:
- Who conducted the poll, and who sponsored it? Sponsorship can provide some clues about possible bias or agenda.
- Who was interviewed? Was it all adults in the population, just the people in one state, only registered voters, or some special subgroup in the population such as teachers or people who home-school their children?
- How was the poll conducted? Was it by telephone, mail, online, in person? No method is perfect, but this information should always be disclosed.
- How were people selected for the poll? Were they selected randomly, or were they allowed to “opt in” to be a part of it? This can sometimes be difficult to determine, but random samples (also called “probability samples”) usually are better samples.
- When was the poll done? Public opinion on most issues is remarkably stable, so you don’t necessarily need a recent poll about an issue to get a sense of what people think about it. But outside events can and do change public opinion, especially when people are first learning about a new topic. It’s also true that polls taken immediately after a dramatic event may overstate the event’s impact on public opinion.
- How many people were interviewed? A poll with more interviews is usually better, but there’s no hard-and-fast rule. A national poll with only 500 respondents, for example, can measure views nationally, but it will generally not be able to break out the views of smaller groups in the population, like Black or Hispanic adults. And if the poll uses inexpensive opt-in participants to pad its sample size, there may be no additional value added.
- Was the poll weighted? If so, how? This is one of the more technical topics in polling, but a good poll almost certainly has been weighted – that is, statistically adjusted to correct for the inevitable difficulties in reaching a representative sample, as mentioned in Lesson 2. Polls should state whether or not they are weighted, and good polls should provide details about the weighting. The absence of this information is a red flag.
- Do the poll’s questions look like they are neutral and fair? You may not be an expert on polling or the subject of the poll, but you can read a question and make a judgment as to whether the pollster is trying to get a particular answer (again, review Lesson 2). Be sure to look at all the questions in the poll, too: Sometimes a question asked earlier in a poll can affect how later questions are answered. This short video provides more detail about best practices in writing survey questions.
If you are looking at election polls specifically, all of the above matters, and there are a few additional things to be aware of.
Why should I turn to polls to understand public opinion?
Polls aren’t the only way to learn about public opinion, but they are the most comprehensive and least biased way.
Calls and letters to lawmakers provide a view of public opinion, but they’re limited to those who feel strongly about an issue and have the time, energy and skills to craft and send a message. Talking to your friends may give you a sense of how they feel about a subject, but your friends are what we call a “self-selected sample” and can’t represent the range of experiences and opinions found among the larger population of your country, state or even local community.
By contrast, polls work the way democracy is supposed to work: They give everyone an equal chance to be heard. Good opinion polls represent the full range of views in a population.
If you’re trying to learn what the public thinks about a subject, it’s important to remember that no single survey question can provide a perfect view of public opinion on an issue. Most issues are complicated and multifaceted. Moreover, the specific words used in a question may evoke different responses than alternative words that seem similar to the researcher.
For this reason, we highly recommend that you look at a variety of measures of opinion on a topic, including:
- How important is the issue to people, especially in relation to other issues?
- How much do people know about the issue?
- How has opinion on the issue changed over time?
- How are different groups experiencing and thinking about an issue?
- Can data from sources other than surveys help us understand what surveys tell us?
Pew Research Center tries to provide that kind of variety in many of our reports. But you can also look for questions about a topic from many different polling organizations. We’d particularly recommend polls by Gallup, The Associated Press-NORC Center for Public Affairs Research and KFF (for health-related public opinion). You can search a database of our survey questions here.
A few last thoughts
Pew Research Center has an entire team devoted to studying how polling works and how to make it better. We provide advice and guidance to the research teams at the Center and also write a lot about the work we are doing to continuously improve our polling. To keep up with our work, follow us on X (formerly Twitter) or sign up for our quarterly Methods newsletter.
We hope you’ve found this course helpful and easy to understand. We’d love your feedback! We’re also interested in your suggestions for which topics to tackle next. Send us a note at minicourses@pewresearch.org.
Test your knowledge.
Want to see just how much you learned about polling? Take our 10-question quiz.
Invite a friend.
If you enjoyed the course, we’d be honored if you would recommend it to your friends.
Thanks for reading,

Scott Keeter
Senior Survey Advisor
Pew Research Center
