Survey researchers are frequently interested in measuring changes in public attitudes and behaviors over time. To do so reliably, they try to use the same methodology for every survey. This increases confidence that any observed changes are true changes and not the result of methodological differences. (This earlier Decoded post looks at how researchers can measure changes in public opinion when there has been a change in a survey’s methodology.)
There are many design features that pollsters try to hold constant when measuring trends over time, including question wording, sampling frame, mode of interview, contact procedures and weighting. Probability-based surveys that use the same methodology generally produce samples that are consistent in their composition. For example, across four random-digit-dial surveys that Pew Research Center conducted using the same methodology in 2018, there were no significant differences in the combination of respondents’ self-reported age and educational attainment.
But what about polls that use online opt-in samples instead of a probability-based approach? In this post, I’ll examine whether online opt-in or “nonprobability” surveys are consistent in the same ways as probability-based surveys, a step toward better understanding the possibilities and challenges inherent in trending nonprobability estimates over time.
Background
Many studies have found that opt-in samples from different vendors can vary wildly. Even when working with the same sample vendor and using the same design specifications, there are a number of factors outside the researcher’s control that could result in inconsistencies in sample composition across surveys.
For example, an online opt-in vendor might draw a sample from just one panel or from bits and pieces of dozens of panels, each of which might have different ways of recruiting and incentivizing panelists. Even within the same panel, multiple surveys are often being fielded at the same time, and proprietary, “black box” methods are used to route panelists to surveys according to each survey’s quotas. Panels also might make behind-the-scenes changes to the way they recruit over time, and panels can merge with one another without warning. With this amount of churn and variation, it is not clear whether multiple samples purchased from the same vendor over a short period of time will resemble one another in the same way that probability-based surveys do.
To empirically explore this question, Pew Research Center fielded three identical surveys in consecutive months — April, May and June 2018 — with the same online, opt-in sample vendor. The surveys all had approximately 2,000 respondents and all used the same quota specifications: after a certain point, the survey was only open to respondents with certain demographic characteristics so that the final, unweighted sample would reflect pre-specified distributions.
The questionnaire consisted of 95 attitudinal and behavioral questions across a range of topics, including politics, community, religion and technology use. The questionnaire included questions for which large changes in opinion in the span of three months would be unlikely. It did not ask, for example, about the (then-upcoming) 2018 midterm elections. That way, researchers could be more confident that any substantial differences between the survey estimates were artifacts of the sampling process and not attributable to real changes in public opinion.
With few exceptions, survey outcomes were consistent across surveys
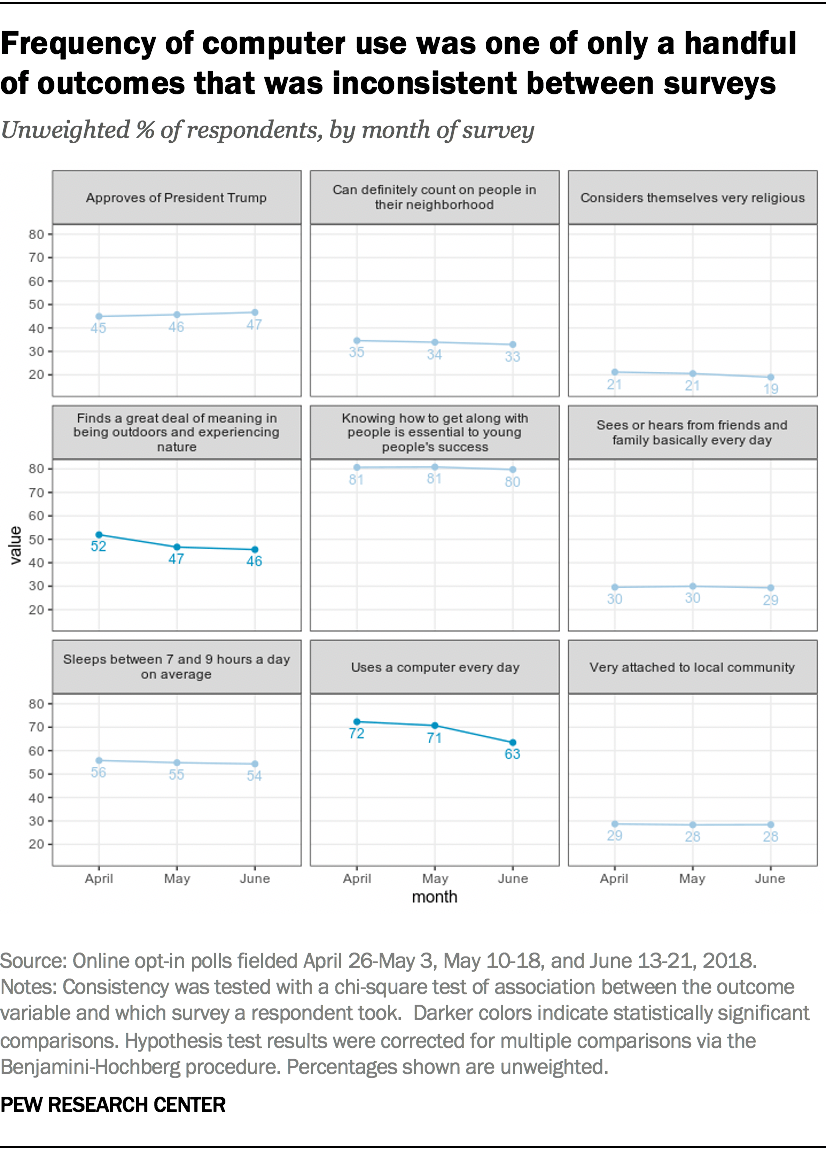
On the whole, the three surveys proved remarkably consistent. Out of the 95 attitudinal and behavioral outcomes examined, only two differed significantly between the April, May and June surveys.

The share of respondents who said they use a computer “every day” dropped by 9 percentage points between April and June, from 72% to 63%. Meanwhile, the share of respondents who found “a great deal” of meaning and fulfillment in being outdoors and experiencing nature dropped from 52% in the April survey to 46% in June.
These were the only questions that resulted in statistically significant differences over time. Other outcomes examined — such as whether respondents felt “very attached” to their local community, approved of President Donald Trump, considered themselves “very religious” or slept between 7 and 9 hours a day — were consistent across surveys.
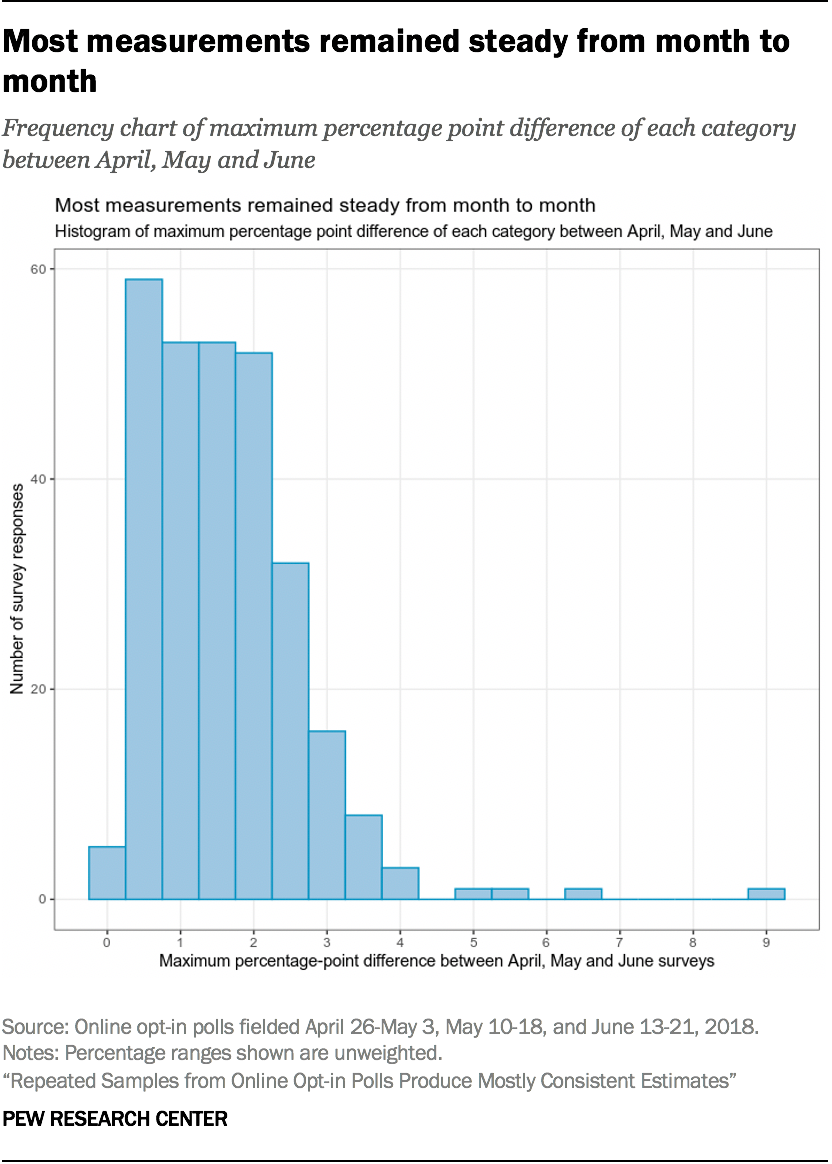
The 9-percentage point difference between April and June in the share of respondents who use a computer “every day” was an especially noticeable outlier in this experiment. The vast majority of categories explored in the 95 questions (267 out of 285) differed by 3 percentage points or less from month to month.
There is no obvious explanation for why computer use was an outlier, and the scattershot nature of the other statistically significant changes suggests it may have been mere “noise.” While large percentage point differences remained after weighting, none of the weighted chi-square tests we used returned statistically significant results.

Scant evidence of inconsistency in estimates among subgroups
One of the initial hypotheses of our study was that subgroups — particularly harder-to-reach ones — might vary more noticeably in their composition from survey to survey due to potentially being pulled from an eclectic array of sources. In other words, estimates among particular subgroups — such as people with a high school diploma or less education — may have changed even though the overall estimates didn’t change. However, 92 out of 95 outcomes examined had no statistically significant differences among subgroups, and the subgroup differences we did observe did not follow any discernible pattern.
On the item about daily computer use, there were statistically significant differences between surveys for women, White adults, Hispanic adults, those with a high school diploma or less education, those who identify as Republican or lean to the GOP, and those ages 35 to 54.
Only two other subgroup comparisons showed statistically significant differences across surveys. On the item about finding a great deal of meaning and fulfillment in being outdoors and experiencing nature, we observed a statistically significant difference among women. Finally, among political independents (who made up just over a third of respondents), the share of those who found a great deal of meaning and fulfillment in spiritual practices such as meditation fell from 27% in April to 21% in June. This outcome was not statistically significant among all respondents. Similar to what we found in the overall sample, these results were likely mere “noise” as well.
All in all, there was little evidence of inconsistency across our samples, and the inconsistencies that were present were generally corrected through weighting. That said, we only examined three samples obtained over a relatively short period of time. It’s hard to know whether these results would replicate over a longer timeframe or with a different vendor.
It’s also important to consider that consistency is no guarantee of accuracy. This goes for probability and opt-in samples alike. A procedure that systematically over- or underrepresents certain segments of the population can yield stable estimates that are consistently wrong. Researchers have found that opt-in surveys produce estimates that are reliable but consistently several percentage points or more off from the actual population value, as indicated by high-quality benchmarks. In other words, a survey’s estimates can simultaneously be reliable and wrong. So while this study’s findings on consistency are encouraging, that is only a part of the story when it comes to overall accuracy.
A note on significance testing
We used chi-square tests of association to determine whether estimates from the three surveys differed significantly from one another or not. In other words, the online opt-in surveys would be considered consistent if the estimates for the attitudinal and behavioral questions we placed on the survey were mostly unaffected by whether respondents answered the survey in April, May or June.
We conducted separate sets of tests without and with weighting, as well as separate tests for the full sample and for subgroups (sex, age, education, race/ethnicity, and partisan affiliation). With the sheer number of tests, we expected some of them to indicate a difference even when none existed, otherwise known as a false positive. To correct for this, we adjusted p-values via the Benjamini-Hochberg procedure. Rather than merely setting the threshold for significance to the conventional p < 0.05, the Benjamini-Hochberg procedure adjusts p-values upwards to control the false discovery rate, or the percentage of false positives out of all positives, to 5%.


