We’re in the thick of election season and political polls are everywhere, with good reason.
Surveys can give insights into more than just the presidential horse race. They can tell us how the public feels about specific issues, give us a sense of people’s political priorities, and more. A well-designed poll gives everyone in the population an equal voice, providing information that isn’t available anywhere else.
At Pew Research Center, we conduct public opinion research to inform people about the issues, attitudes and trends shaping the United States and the world. Below, we’ve compiled some tips for journalists who use polling in their work.
How can journalists use polls in their reporting?
Surveys provide unique insights about people’s views and experiences. These data-based facts can be widely applied to journalists’ work. Journalists can always interview a few voters for this perspective, of course, but a good survey provides a systematic and representative picture of public opinion.
When it comes to idea generation and writing, polling data can spark research questions and story ideas. For example, reporters can use surveys to show how standalone stats – say, unemployment or crime rates – are actually being experienced by people.
Survey results can also raise new questions or provide data to back up what already seems to be true. For example, our surveys find bipartisan support for several changes in election procedures, like making Election Day a holiday. Pointing to this finding could be a way for journalists to ask their local elected leaders about their own stance on broadly popular ideas. Our surveys also show that young people are less likely to seek out news about politics than older people. They’re also less likely to vote. Highlighting this trend would be a data-centric way for a local reporter to justify a story focusing on young people in their community.
How are polls generally conducted these days?
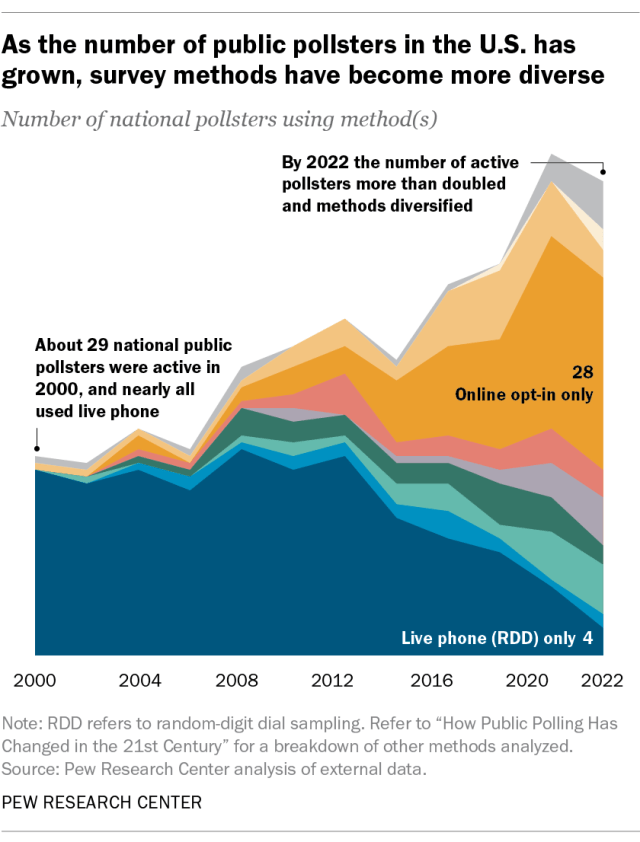
Most polls used to be conducted by phone. Now, most are conducted online or with a combination of online and phone interviews. At Pew Research Center, most of our domestic surveys fall into the latter category: We typically poll Americans online and by phone.

Just since 2016, there has been considerable methodological change in the polling industry.
Some 61% of U.S. polling organizations that conducted and publicly released national surveys in both 2016 and 2022 had changed their methods by 2022. The reason is that polling has gotten much harder and more expensive to do well. It’s more difficult to reach people and persuade them to participate.
This has led to two big changes. First, high-quality polling that uses random sampling – where every person in the population has a known chance of being included – has increasingly adopted residential address-based methods of reaching people (though some high-quality telephone polling is still being conducted).
Second, there has been rapid growth in inexpensive online polling that uses opt-in sampling, where people may volunteer to participate in exchange for money or other rewards. Unfortunately, our research has shown that this kind of polling is prone to much larger errors than surveys that use random sampling, especially for subgroups like young adults or Hispanic people.
How are election surveys unique? What do they usually measure, and when are they most accurate?
Election polls are perhaps best known for giving a snapshot of the horse race – the level of support for the major candidates. A unique feature is that such polls not only measure candidate preference but also usually attempt to identify who will actually vote. This is not easy: A lot of people who say they will vote don’t show up, and some who say they won’t vote will, in fact, turn out.
But election polls measure much more than that. They identify why people are voting or not voting, what kinds of people are voting for each candidate, what issues and concerns are motivating their participation, how satisfied they are with the choices they have, and how much they trust the process to be fair.
In a close election, the horse race numbers must be extremely accurate to correctly indicate who will win – a nearly impossible task given the challenges and inherent uncertainties in polling, as well as the closeness of recent presidential elections. But that level of accuracy is not essential for other kinds of information in the poll to be useful.

What type of information can’t we confidently glean from election polls? When should journalists exercise caution?
People are not good judges of what they might do in the future, especially in reaction to some hypothetical event. Beware of questions such as, “Would X make you more or less likely to support [candidate]?” Those results should not be taken as a predictor of future behavior.
We also counsel caution about the value of polls taken immediately after a big news event. Truly consequential events take a little time to affect public opinion.
Are presidential election polls still a reliable tool for understanding public sentiment? Have the problems in past election polls been fixed?
It’s the biggest question pollsters are asking themselves! Polling did pretty well in 2018 and 2022, but it has struggled when Donald Trump is on the ballot, most likely because his supporters are somewhat less willing to participate in polls or because pollsters incorrectly assume they won’t vote.
But how accurate a poll is depends on what the poll is trying to measure. Polling may never be able to nail an election forecast in a highly competitive contest, in part because polls have trouble predicting people’s future behavior and in part because many elections are decided by margins smaller than the typical margin of sampling error. Polls are most useful for determining things like whether the public has favorable or unfavorable opinions of candidates, where people stand on the issues, or which issues matter to which voters.
Polling methodology is changing partly in an effort to do a better job of reaching people who are reluctant to take surveys or vote. Greater use of address-based sampling and multimode data collection are among the ways pollsters are trying to improve the representativeness of their samples.
What are some of the most common pitfalls when journalists report on surveys?
While using survey findings in reporting and writing can provide valuable perspective, framing findings incorrectly can muddle the facts and distort public understanding. Fortunately, most common mistakes are easily avoided if you know to watch for them. Here are a few of the big ones:
- The margin of sampling error (usually just “margin of error”) understates the amount of error in a poll because it reflects possible error from only one source: taking a sample of the population rather than interviewing everyone. Journalists should understand that polls also have error from sources other than sampling error. Reporters should not imply that a poll has more precision than it does. For example, don’t report decimal places in poll results. And don’t describe something as “a majority” if it is within the margin of sampling error of 50% – e.g., 51% when the margin of error is plus or minus 3 percentage points.
- Avoid describing one statistic as larger than another when it isn’t. Similar to the point above, check a survey’s margin of error before comparing two values, especially if they’re close. Reporters may be tempted to say that one political candidate is “leading” another, but that may not accurate if the “lead” is within the margin of error.
- Be careful when looking at subgroups of people. Smaller groups usually have larger margins of error than the total population. For example, Asian Americans accounted for just 7% of the nation’s population as of 2022, so the margin of error may be higher when looking specifically at the views of Asian Americans.
- Don’t paraphrase the wording of questions about issues if doing so could mislead readers about what was actually asked.
- Be clear about who was polled. Does the poll look at the total U.S. population? Eligible voters? Registered voters? Likely voters?
If in doubt, reach out to the organization that fielded the survey. At Pew Research Center, we’re always happy to answer reporters’ methodological questions and offer guidance on responsible ways to frame our findings.
How can journalists decide which polls to trust?
The safest approach is to rely on polling from organizations with a track record in survey research, like many of those that conduct studies for major media outlets. Most use probability sampling methods. They have multiyear records you can examine, are usually transparent about their methodology, and have strong incentives to be accurate.
Lack of transparency is a red flag, as is polling from campaigns or advocacy groups that do not regularly release results. For these kinds of polls, always ask, “Why is this poll being released when most of their polls are not?”
The major association of polling professionals, the American Association for Public Opinion Research (AAPOR) maintains a list of polling organizations that have committed to transparency.
Are polling aggregators better than individual polls?
Polling aggregators – sites that compile and average the results of many polls – can help us understand what the public prefers. Aggregation works on the assumption that multiple polls can provide greater confidence than any single poll, in part because the errors in individual polls may cancel out in the aggregate.
But mixing low-quality polling with high-quality polling may only be adding more error, so journalists should look at which polls are included and whether the aggregator adjusts for poll quality. It’s also true that some polling errors – like the underestimation of Trump’s support in Midwestern states in 2016 – are likely to affect nearly all polls. Simply aggregating them won’t fix that type of error.
Understanding and writing about polls
- Public opinion polling basics (Pew Research Center)
- Guide to surveys and polling (American Association for the Advancement of Science)
- A “cheat sheet” to understanding polls (American Association for Public Opinion Research)
- 5 tips for writing about polls (Pew Research Center’s Decoded blog)
- How public polling has changed in the 21st century (Pew Research Center)
- Comparing random sampling and opt-in panels (Pew Research Center)
- Methods 101 video series (Pew Research Center)
Special considerations for election-related polling
- Key things to know about election polling in the United States in 2024 (Pew Research Center)
- A basic question when reading a poll: Does it include or exclude nonvoters? (Pew Research Center)
- 5 key things to know about the margin of error in election polls (Pew Research Center)
Note: This story was originally published in the special 2024 elections issue of The Investigative Reporters and Editors Journal.