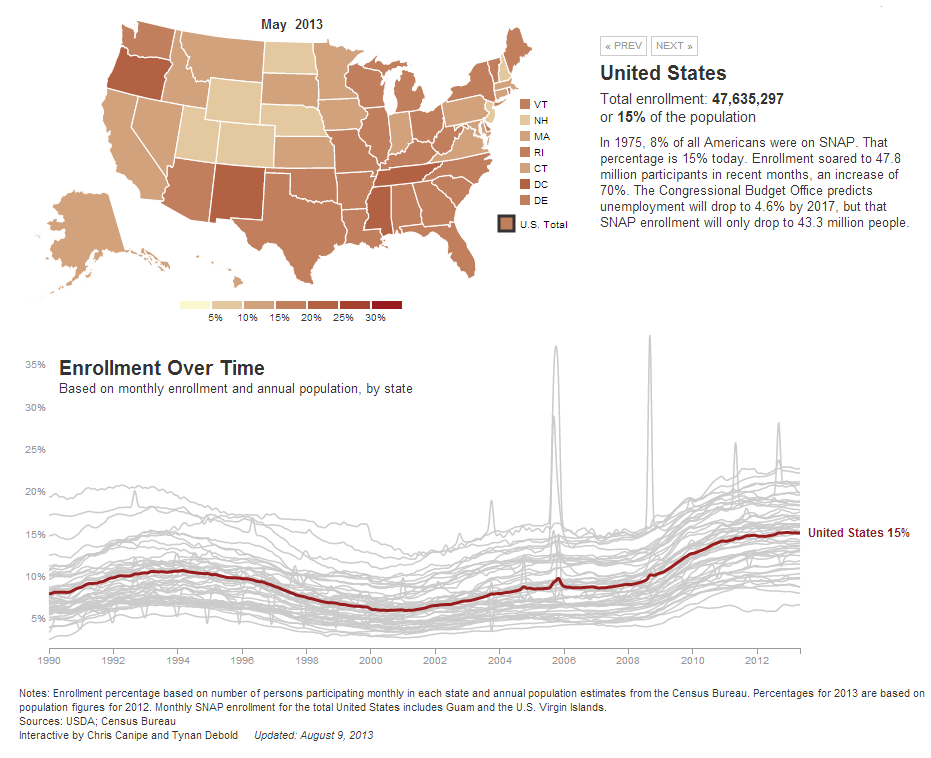
Participation in the federal food stamp program (formally the Supplemental Nutrition Assistance Program) soared following the 2008-09 financial crisis, both in raw numbers and as a share of the population. As of May, the most recent month for which data are available, 47.6 million people, or 15% of the population, received food stamps; in fiscal 2007, before the Great Recession, participation averaged 26.3 million people, or 8.7% of the population.
But individual states differ widely, not just in participation rates (23% in D.C., 7% in Wyoming) but in their patterns as well. Using data from the Agriculture Department and the Census Bureau, The Wall Street Journal built this nifty interactive chart that allows users to visualize those state-by-state differences.
Louisiana, for example, typically has one of the nation’s highest food-stamp participation rates, but participation soars during major natural disasters — such as Hurricanes Katrina and Rita in 2005, Gustav and Ike in 2008, and Isaac this past September. Mississippi’s participation also spiked after Katrina and Rita; in May 2011, a spate of severe weather in Alabama led to a jump there.
Alaska’s SNAP participation regularly drops late in each year, giving its chart a bit of an EKG-like appearance. That’s almost certainly due to the dividend payments Alaskans receive in or near October of each year from that state’s Permanent Fund. The dividend, which was $878 last year, fluctuates based on the Permanent Fund’s earnings; it can represent a significant source of cash income for many Alaskans, especially in rural areas.

