Over the past few decades, Republicans and Democrats have become more and more sharply divided – not just ideologically, but also geographically. Democrats tend to do best in the nation’s urban areas, while Republicans find their strongest support in more rural areas. Now, a new Pew Research Center analysis of county-level presidential-voting data quantifies just how dominant Democrats are in big cities – and analysts say this dominance will present a tough challenge to Donald Trump this November.
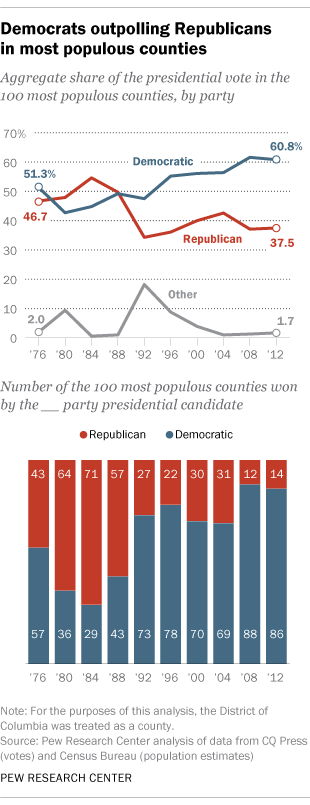
In 2008 Barack Obama won 88 of the 100 most populous counties; in his re-election bid four years later he won 86. Given Obama’s popularity among racial and ethnic minorities and young adults – who tend to cluster in big cities – that’s not altogether surprising. But Democrats’ urban dominance precedes Obama: The last time a GOP presidential candidate won more than a third of the 100 largest counties was 1988, when George H.W. Bush took 57 of them.
The disparity also is reflected in the parties’ share of the big-county vote. As recently as 1988, they were essentially even: Bush took 49.7% of the total vote in the 100 largest counties, while Michael Dukakis took 49.2%. But the Republican vote share fell steeply in 1992 and never really recovered: Since then, George W. Bush was the only GOP presidential candidate to receive more than 40% of the vote in the 100 largest counties (in 2004). Meanwhile, Democrats’ vote share in those counties has grown steadily, exceeding 60% in Obama’s two races.
This wasn’t always the case. Up to the 1990s, in fact, urban America was competitive territory for both Republican and Democratic presidential candidates: Ronald Reagan carried solid majorities of the 100 largest counties in both 1980 and 1984. In 2012, by contrast, Mitt Romney won only four counties with populations greater than 1 million: Maricopa County, Arizona; Orange County, California; Tarrant County, Texas; and Salt Lake County, Utah.
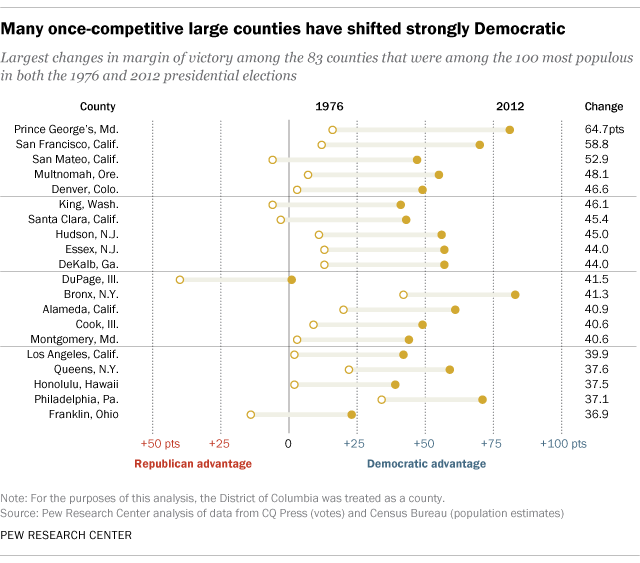
Most of the biggest counties have become more presidentially Democratic over the past four decades. We took a closer look at vote patterns in the 83 counties that were among the 100 most populous in both 1976 and 2012. In more than half (46 counties), the Democratic-Republican split shifted in the Democrats’ favor by more than 20 percentage points; only nine became less Democratic to any degree.

For example, Illinois’ DuPage County, a longtime GOP stronghold just to the west of Chicago, went for Gerald Ford by more than 40 percentage points in 1976 (68.8% to 28.3%). But it went for Obama twice, by nearly 11 percentage points in 2008 and by 1.1 percentage points in 2012.
One caveat is in order about Democrats’ big-county advantage: Even as their grip on these counties has tightened, they carry less electoral heft than they used to. The 100 largest counties in 1976 together cast almost 44% of the total vote in that year’s presidential election; in 2012, the top-100 vote share had slipped to 39.4%.
In recent decades Americans have increasingly sorted themselves politically. A 2014 Pew Research Center report on political polarization found that liberals are about twice as likely as conservatives to live in urban areas, while conservatives are more concentrated in rural areas.
