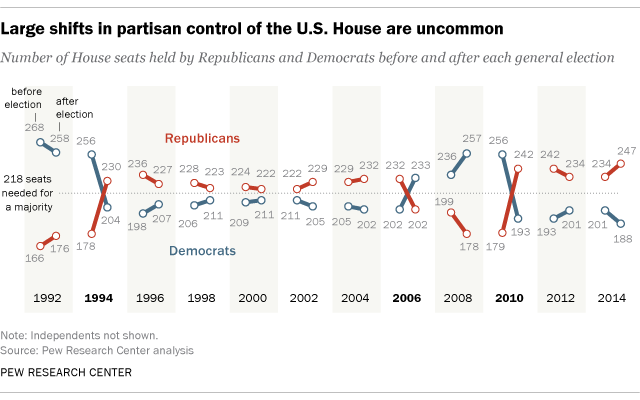
With Election Day 2016 a little over two months away, many political analysts are projecting Democrats to gain seats in both the House and Senate. But winning the 30 seats they need to wrest control of the House from the Republicans is generally seen as a longer shot than the four or five Senate seats they’d need to lead that chamber (depending on whether or not Hillary Clinton is elected president and Tim Kaine, as vice president and president of the Senate, has a tie-breaking vote).
Shifts of that magnitude are uncommon but not unprecedented: In three of the past 12 two-year election cycles, one party has racked up a net gain of 30 seats or more (most recently in 2010, when the Republicans had a net gain of 63 seats). So we thought it was worthwhile to take a closer look at the circumstances under which House seats do, and don’t, switch from Republican to Democratic or vice versa. (In redistricting years, we excluded House districts that were either newly created and those so radically redrawn that no incumbent ran in them.)
One of the biggest obstacles to large swings from one party to the other is that so few incumbents lose their re-election bids. On average since 1992, 93% of House members who actually seek re-election have won. Even in 2010, the re-election rate fell to “only” 85%, with 338 of the 396 representatives running for re-election retaining their seats.
Those statistics are important for an “out” party in shaping its strategy to gain seats because knocking off incumbents has produced more seat switches than has picking up open seats. In 2014, for instance, 13 of the 19 seat switches were due to incumbent defeats. In 2010, a near-record year for seat switches, 55 incumbents were unseated (one in a primary, the rest in the general).
It’s even less common for incumbents to lose their party nominating primaries, but when they do their party almost always retains the seat anyway. Since 2000, a total of 39 House incumbents have lost their primaries; in only five of those cases did their seats flip to the other party.
Given the ease with which most incumbents win re-election, party strategists and media pundits often look for pickup opportunities in open seats – occasioned by the incumbent’s retirement, resignation, death or decision to run for another office. But open-seat switches have become much scarcer the past few election cycles. Out of 44 open seats in 2012 (not counting those created by redistricting), only seven (16%) switched parties; in 2014, only six of 43 open seats, or 14%, switched from one party to the other. As recently as 2010, more than a third of the open seats that year (14 out of 39) switched parties.
The decline of split-ticket voting is another challenge to those seeking to flip control of the House. In presidential-election years, the overwhelming majority of House districts vote the same way for Congress as they do for president: In 2012, for instance, only 26 of the 435 House districts split their vote. And when districts do split, it’s usually to retain their incumbent representative (or his or her party), not boot them out of office. In all but two of the 27 districts that switched parties in 2012, the presidential and House votes were aligned; in 2008, 18 of the 31 switched-seat districts were similarly aligned. (The two years with the most seat switches in recent decades, 1994 and 2010, were both midterm elections.)
So, what’s the state of play in this year’s House races? While a few states have yet to hold their primaries, as of this writing 388 incumbents are running for re-election, 219 Republicans and 169 Democrats. (Five other incumbents, three Republicans and two Democrats, also had sought re-election but lost their primaries.) Sixteen Democrats and 25 Republicans retired or are seeking another office; one Democrat died this summer, leaving his seat open, and because of court rulings there are three newly redrawn districts with no incumbent.
The consensus among political analysts is that only about three dozen House seats are realistically “in play” this year. The Cook Political Report, for instance, rates 19 seats (16 currently held by Republicans, three by Democrats) as “toss-ups”; seven seats (four of which are now held by Republicans) are competitive but lean Democratic, while 11 GOP-held seats are rated as leaning Republican.
