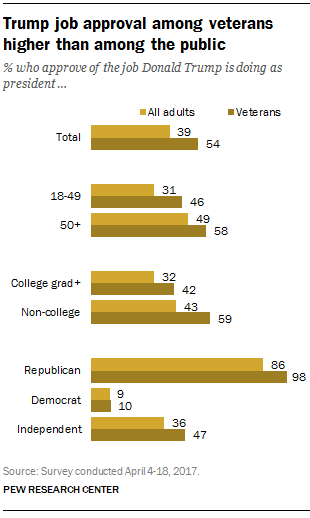
U.S. veterans, who broadly supported Donald Trump in the 2016 election, have remained positive about the job he is doing as president. In April, 54% of those who have served in the military approved of his job performance. Trump’s job approval among the overall public was just 39%, according to the same survey, which was conducted using Pew Research Center’s American Trends Panel.
Both younger and older veterans gave higher approval ratings for Trump than did younger and older adults overall. Nearly half of veterans ages 18 to 49 (46%) approved of Trump’s job performance, compared with only 31% of all adults younger than 50. Among those 50 and older, nearly six-in-ten veterans (58%) supported Trump, while about half of all older adults (49%) said the same.
The same pattern held for level of educational attainment. Approval of Trump was higher among both college-educated veterans and those with no college degree than it was for these groups among the public as a whole.
The April survey found that 98% of veterans who identify as Republicans approve of Trump; among Democratic veterans, the share was just 10%. Among the public overall, 86% of Republicans approve of Trump, compared with only 9% of Democrats.

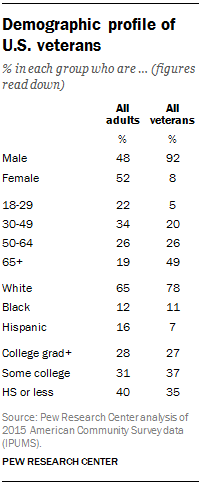
Still, the demographics of military veterans are a factor in Trump’s higher approval ratings among this group. Compared with the public as a whole, veterans are more likely to be male, white and older – all demographics in which support for Trump tends to be higher.
Roughly nine-in-ten veterans are male (92%) while 8% are female, according to Census Bureau data from 2015. Nearly half of veterans in the U.S. (49%) are ages 65 years and older; this age group makes up just 19% of the public overall. And veterans remain more likely to be white than the public overall: Roughly eight-in-ten veterans (78%) are white, compared with about two-thirds (65%) of all adults.
Last fall, Trump held a wide 60%-34% advantage over Hillary Clinton among veterans, according to the national exit poll conducted by Edison Research for the National Election Pool as reported by CNN. Eight years earlier, veterans backed John McCain over Barack Obama by 54% to 44%. (The national exit poll didn’t ask about veteran status in 2012.)

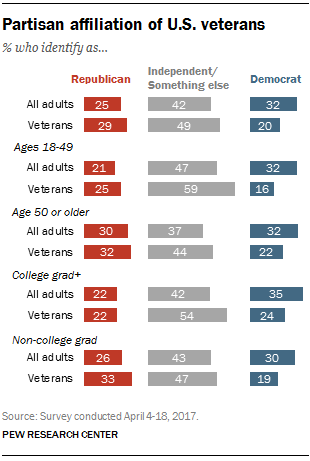
In the April survey, veterans were more likely than the public overall to identify as independents, but they were about as likely as adults overall to identify as Republicans. Just 20% of veterans identified as Democrats, compared with about a third of all adults.
When the partisan leanings of independents are taken into account, a majority of veterans (56%) either identified as Republicans or leaned toward the GOP; just 40% identified as Democrats or leaned Democratic. Among the public, these numbers were almost the reverse: 43% identified as Republicans or leaned Republican, while 54% identified or leaned Democratic.
While this analysis evaluates the importance of demographic traits one by one, it is possible to use more advanced statistical analysis to look at the relative impact of each of these factors. This statistical analysis confirms that even accounting for demographic factors such as age, gender and education, being a veteran is associated with higher levels of partisan identification with the GOP.
Note: View methodology (PDF).