The Great Recession of 2007-2009 triggered a sharp, prolonged decline in the wealth of American families, and an already large wealth gap between white households and black and Hispanic households widened further in its immediate aftermath. But the racial and ethnic wealth gap has evolved differently for families at different income levels, according to a new Pew Research Center analysis of data from the Federal Reserve Board’s Survey of Consumer Finances.
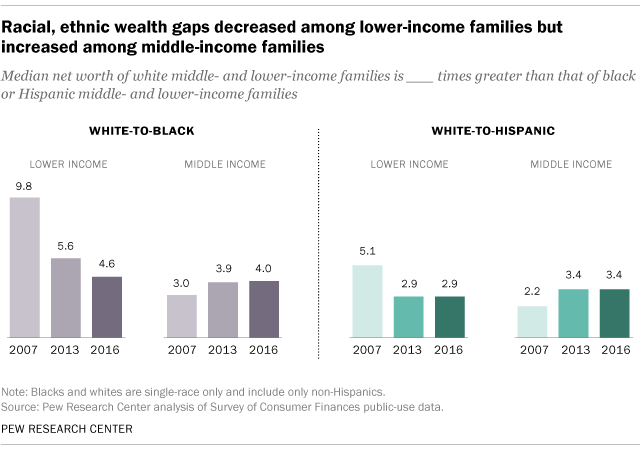
Among lower-income families, the gap between white households and their black and Hispanic counterparts shrank by about half from 2007 to 2016. But among middle-class families, it increased and shows no sign of retreating. (There are an insufficient number of observations in the SCF data to report on upper-income black and Hispanic families separately.)

Overall, American household wealth has not fully recovered from the Great Recession. In 2016, the median wealth of all U.S. households was $97,300, up 16% from 2013 but well below median wealth before the recession began in late 2007 ($139,700 in 2016 dollars). And even though overall racial and ethnic inequality in wealth narrowed from 2013 to 2016, the gap remains large. In 2016, the median wealth of white households was $171,000. That’s 10 times the wealth of black households ($17,100) – a larger gap than in 2007 – and eight times that of Hispanic households ($20,600), about the same gap as in 2007. (Asians and other racial groups are not separately identified in the SCF data.)
Here are some key trends in household wealth across income tiers and racial and ethnic groups. In this analysis, we categorized families by their household income, after adjusting their incomes for family size. Middle-income families have size-adjusted incomes between two-thirds and twice the national median size-adjusted income. Lower-income families have a size-adjusted household income less than two-thirds the median and upper-income families more than twice the median.
This analysis is based on data from the Federal Reserve Board’s Survey of Consumer Finances (SCF), conducted triennially from 1983 to 2016 (updated Oct. 12, 2017). The surveys from 2007, 2010, 2013 and 2016 span the duration of the Great Recession from December 2007 to June 2009 and the economic recovery thereafter.
The findings by race and ethnicity in this analysis are not comparable to previous analyses by Pew Research Center due to revisions in the racial and ethnic classifications in the SCF. There are an insufficient number of observations in the SCF data to report on upper-income black and Hispanic families separately. Also, Asians and other racial groups are not separately identified in the SCF data.
Wealth, or net worth, is the difference between the value of a family’s assets (such as bank accounts, stocks, bonds, homes, cars and businesses) and its debts. Wealth is accumulated over time and differs from household income, or the annual inflow of wages, interests, profits and other sources of earnings. Wealth gaps between whites, blacks and Hispanics have always been much greater than income gaps and provide an alternative perspective on racial and ethnic inequality in household well-being.
In this analysis, we categorized families by their household income, after adjusting their incomes for family size. Middle-income families have size-adjusted incomes between two-thirds and twice the national median size-adjusted income. Lower-income families have a size-adjusted household income less than two-thirds the median and upper-income families more than twice the median.
For a family of three in 2016, a household income of about $42,500 to $127,600 qualifies as middle income, based on SCF data. Lower-income households live on less than $42,500 and upper-income households earn more than $127,600. This methodology results in 47% of America’s families being classified as middle income in 2016. About one-third of families (32%) were lower income and 21% were upper income.

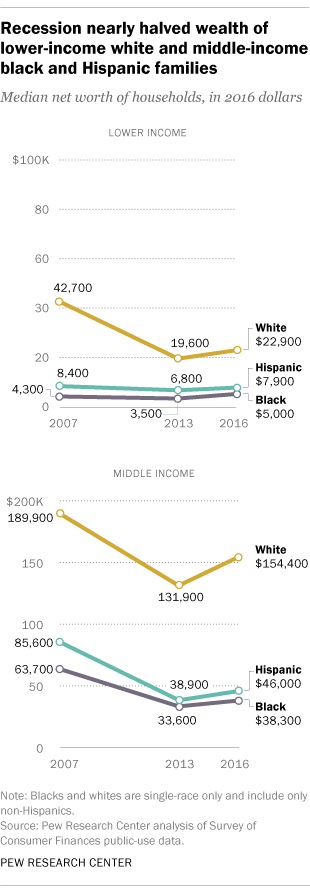
Among lower- and middle-income households, white families have four times as much wealth as black families and three times as much as Hispanic families. In 2016, lower-income white households had a net worth of $22,900, compared with only $5,000 for black households and $7,900 for Hispanic households in this income tier. To some degree, this reflects differences in homeownership rates among families – 49% for lower-income whites, versus 31% for lower-income blacks and 30% for lower-income Hispanics. It is also important to note that only 25% of white households are in the lower-income tier, compared with about 50% each of black and Hispanic households. Thus, low levels of wealth are much more prevalent among black and Hispanic households than among white households.
About the same level of wealth inequality exists among middle-income households. White households in the middle-income tier had a median net worth of $154,400 in 2016, compared with $38,300 for middle-income blacks and $46,000 for middle-income Hispanics. Homeownership rates among middle-income blacks (53%) and Hispanics (60%) are also less than among middle-income whites (76%). Half of white households, 42% of black households and 40% of Hispanic households are in the middle-income tier.
Lower-income white families experienced greater losses in wealth during the recession than lower-income black and Hispanic families did. Prior to the recession in 2007, lower-income white families had 10 times as much median wealth as lower-income black families – $42,700 versus $4,300 (figures in 2016 dollars). Lower-income Hispanic families had a median net worth of $8,400, lagging white families by a ratio of five-to-one.
These large wealth gaps were trimmed roughly in half by the Great Recession, which cut the median wealth of lower-income white households to $21,900 in 2010, a loss of 49%. Losses for lower-income black and Hispanic households were much smaller, 3% and 5%, respectively. The larger losses for lower-income white families may have arisen from their greater exposure to the housing market crash. In 2007, 56% of lower-income whites were homeowners, compared with 32% each of lower-income blacks and Hispanics. The homeownership rate among lower-income whites has trended downward since then, falling to 49% by 2016, but the rate for blacks and Hispanics is largely unchanged.
The share of lower-income white households that have no wealth or are in debt was higher in 2016 than in 2007, but the opposite is true among lower-income black and Hispanic households. A corresponding sign of recession-induced stress on household portfolios is the share of families with zero net worth or in debt. This share edged up among lower-income white families, from 14% in 2007 to 17% in 2016. Meanwhile, the share of lower-income black families with zero or negative net worth decreased from 32% to 23% and the share among lower-income Hispanic families fell from 23% to 15%. In contrast, among middle-income families, the share with zero net worth or in debt increased from 2007 to 2016, from 6% to 9% among whites, 9% to 18% among blacks, and 9% to 13% among Hispanics. Overall, black and Hispanic families are more likely than white families to have zero net worth or to be in debt.
Racial and ethnic wealth inequality among middle-income families increased with the recession and has not retreated in the recovery. Middle-income black and Hispanic families took a substantial hit in the recession. The median wealth of middle-income blacks fell to $33,600 in 2013, down 47% from 2007. Likewise, the median wealth of middle-income Hispanics dropped to $38,900 in 2013, a loss of 55% since 2007. Meanwhile, middle-income white families experienced a less substantial loss of 31% in this period, as their median wealth fell to $131,900. As a result, racial and ethnic wealth inequality among middle-incomes families increased during or after the recession. From 2007 to 2013, among those in the middle-income tier, the white-to-black wealth ratio increased from three-to-one to four-to-one, and the white-to-Hispanic wealth ratio increased from two-to-one to three-to-one. These margins did not diminish from 2013 to 2016.

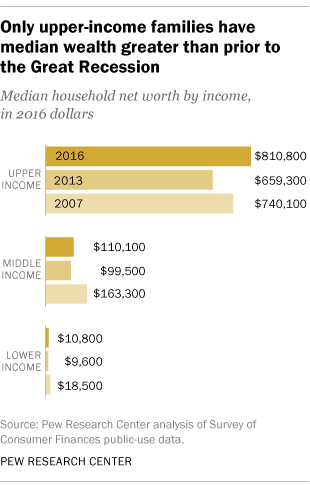
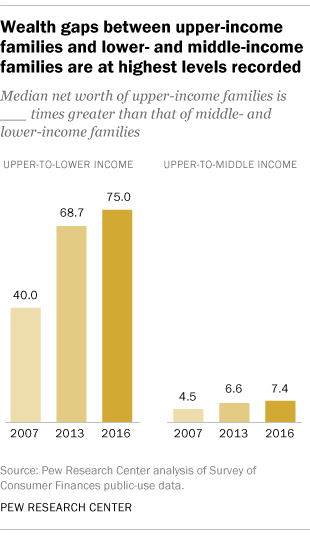
Wealth gaps between upper-income families and lower- and middle-income families are at the highest levels recorded. Although lower- and middle-income families overall experienced gains in wealth in recent years, they were not large enough to make up for the losses these families sustained during the recession. Thus, in 2016, the median wealth of lower-income families was 42% less than in 2007 and the median wealth of middle-income families was 33% lower. Indeed, the net worth of these families in 2016 – $10,800 for lower-income families and $110,100 for middle-income families – was comparable to 1989 levels.

The experience of upper-income families is markedly different. Their losses in the recession were smaller and their recovery was stronger. By 2016, upper-income families had a median wealth of $810,800, 10% more than prior to the recession in 2007. Moreover, the median wealth of upper-income families is at the highest level since the Federal Reserve started collecting these data in 1983. Consequently, the recession drove wealth inequality between upper-income families and lower- and middle-income families to the highest levels recorded. In 2016, the median wealth of upper-income families was seven times that of middle-income families, a ratio that has doubled since 1983. Upper-income families also had 75 times the wealth of lower-income families in 2016, compared with 28 times the wealth in 1983.
Upper-income white families have grown wealthier. Among upper-income families, white households had a median net worth of $971,500 in 2016, notably higher than the overall median for this income tier. Moreover, the median wealth of upper-income white families in 2016 was 25% greater than its pre-recession level, an increase greater than for all upper-income families combined.
There is also a growing separation in wealth among white households by income tier. In 2016, upper-income white families had six times as much wealth as middle-income white families, compared with four times as much prior to the recession. Upper-income white families also had 42 times the wealth of lower-income white families in 2016, compared with 18 times the wealth in 2007.
Overall, the state of wealth inequality by race, ethnicity and income level helps explain why Americans say by a margin of two-to-one that the economic system in this country unfairly favors powerful interests. The same Pew Research Center survey also finds a racial and ethnic divide on how Americans view economic inequality: Blacks (65%) and Hispanics (55%) are more likely than whites (42%) to see economic inequality as a very big problem in the country. About one-in-five or fewer whites, blacks or Hispanics view economic inequality as either a small problem or not a problem.

