Most Americans like labor unions, at least in the abstract. A majority (55%) holds a favorable view of unions, versus 33% who hold an unfavorable view, according to a Pew Research Center survey from earlier this year. For most of the past three decades that the Center has asked that question, in fact, Americans have viewed unions at least somewhat more favorably than unfavorably.

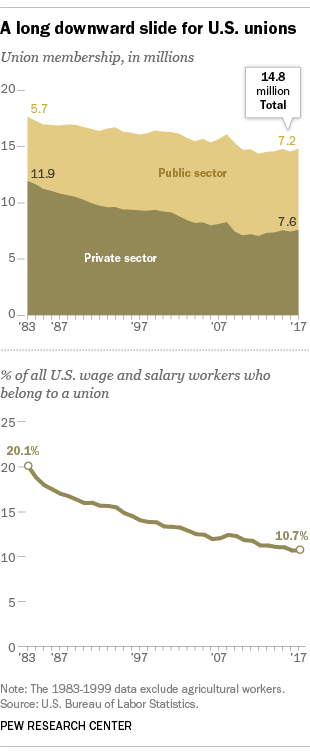
Despite those fairly benign views, unionization rates in the United States have dwindled in recent decades (even though, in the past few years, the absolute number of union members has grown slightly). As of 2017, just 10.7% of all wage and salary workers were union members, matching the record low set in 2016, according to the U.S. Bureau of Labor Statistics (BLS). Back in 1983, when the BLS data series begins, about a fifth (20.1%) of wage and salary workers belonged to a union. (Unionization peaked in 1954 at 34.8% of all U.S. wage and salary workers, according to separate data from the Congressional Research Service.)
The long-term decline of organized labor has affected most parts of the U.S. economy, but not uniformly. In general, the biggest declines in unionization have come in those occupations and industries that were – and to a large extent still are – the foundations of the American labor movement, according to our analysis of BLS data going back to 2000.
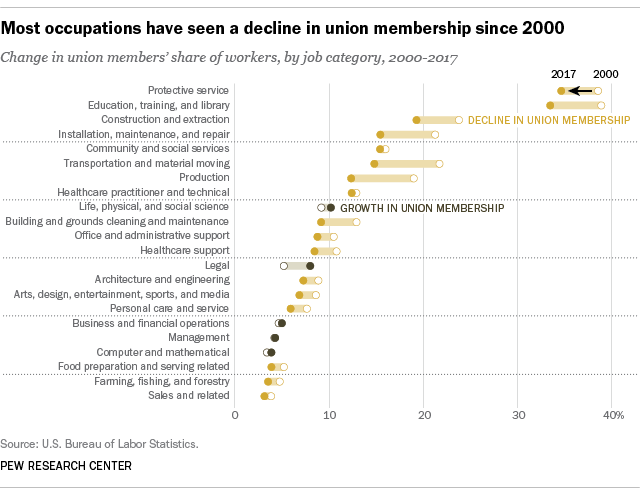
Among the 22 broad occupational categories into which the BLS sorts U.S. wage and salary workers, the biggest decline in union membership from 2000 to 2017 was in transportation and material moving occupations, a broad grouping that includes everything from airline pilots and long-haul truckers to taxi drivers, train conductors and parking-lot attendants. In 2000, nearly 1.8 million of the 8.1 million workers in those occupations, or 21.7%, were union members. By last year, only 1.3 million transportation and material moving workers (14.8%) were unionized, even though total employment in the sector had grown to more than 8.8 million.

Manufacturing-type jobs, both union and non-union, have shriveled in both absolute and percentage terms. In 2000, 2.1 million of the nearly 11.1 million Americans in production occupations (19.0%) were union members. Last year, total employment in that category (which consists mostly of manufacturing-related jobs but also includes bakers, tailors and jewelers, among others) was 8.1 million, only a million of whom (12.4%) were union.
Over that same timespan, unionization rates in installation, maintenance and repair occupations fell from 21.2% to 15.5%. In construction and extraction occupations (such as carpenters, oilfield workers and miners), unionization fell from 23.8% to 19.3%.
The two occupational groups with the highest unionization levels in 2017 were protective service, such as police officers, firefighters and security guards (34.7%), and education, training and library (33.5%). Perhaps not surprisingly, both groups are composed largely of public-sector workers. In 2017, federal, state and local governments had far higher unionization rates overall (26.6%, 30.3% and 40.1%, respectively) than the private sector taken as a whole (6.5%).
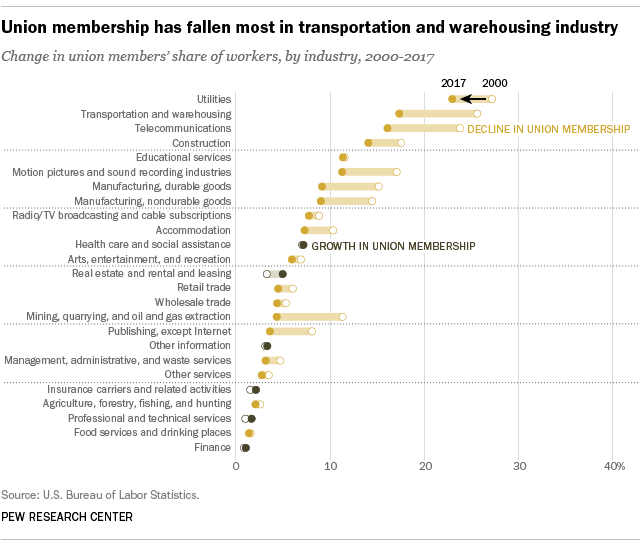
When it comes to industries, meanwhile, utilities (electric, gas and water suppliers) had the highest overall unionization rate last year – 23.0%, though that was down from 28.3% as recently as 2010. Transportation and warehousing had the second-highest private-sector unionization rate, 17.3%, but also saw the biggest decline (8.4 percentage points) since 2000. That year, more than a quarter (25.7%) of workers in that industry belonged to a union.

Not all the news is bleak for labor unions. The total number of unionized workers has grown modestly in recent years: up about 451,000 between 2012 and 2017, to just over 14.8 million. Most of that increase has occurred in two occupational categories: construction and extraction workers and healthcare practitioners and technicians. The construction industry, which was hammered (so to speak) by the housing collapse a decade ago, has recovered most of the 2.2 million jobs it shed between 2006 and 2010. The health care and social assistance industry was barely affected by the Great Recession, and has added more than 1.7 million jobs in the past six years alone.
Globally, the U.S. ranks 29th in its overall unionization rate among the 36 member nations of the Organization for Economic Cooperation and Development, most of which are developed democracies. However, like the U.S., nearly all OECD countries have experienced unionization declines, even those with strong and long-established labor movements: Sweden, for example, has seen its unionization rate fall from 79% in 2000 to 66.1% last year.
More Americans view the long-term decline of organized labor negatively than positively, according to the Pew Research Center survey from earlier this year. About half (51%) say the large reduction in union representation in recent decades has been mostly bad for working people, while 35% say it has been mostly good. Blacks, young adults and people with advanced degrees were most likely to view declining union representation negatively. There also were sharp partisan splits, with 68% of Democrats and Democratic-leaning independents saying the reduction in union membership has been mostly bad for working people and 53% of Republicans and Republican-leaning independents saying it’s been mostly good.
Note: This is an update of a post originally published April 27, 2015.
