Most U.S. veterans who served in the post-9/11 era say their military service was useful in giving them skills and training needed for jobs outside the military, a new Pew Research Center report finds. And in fact, veterans of prime working age generally fare at least as well in the U.S. job market as non-veterans, though there are some differences in the work they do and in which industries.

Overall, the seasonally adjusted unemployment rate for veterans ages 18 and older has been below that of non-veterans nearly every month since January 2003, which is as far back as data from the federal Bureau of Labor Statistics goes. In August, the jobless rate for veterans stood at 3.4%, versus 3.6% for non-veterans.
For both veterans and non-veterans, unemployment rates have been falling from a high of more than 9% in 2010. Veterans’ unemployment bottomed out at a seasonally adjusted 2.4% this past April, while the lowest rate among non-veterans was 3.5% in June.
The overall unemployment figures, though, obscure considerable variation among veterans and non-veterans in different age groups. That’s important because the nation’s 18.8 million veterans skew considerably older than the much larger non-veteran population: Roughly half (46.9%) of veterans are ages 65 and older, according to BLS data, compared with 19.1% of non-veterans.

Older people generally are less likely to work, or seek work, than younger people – a statistic called the labor force participation rate. While more non-veterans 65 and older are working or seeking work than in previous years (20.5% as of August), the share of 65-and-older veterans participating in the labor force has been trending lower since 2016, reaching 18.5% in August.
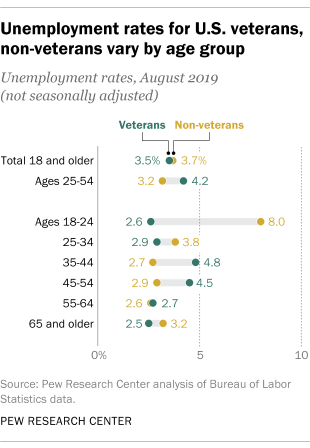
For the youngest group of veterans, those ages 18 to 24, the unemployment rate was just 2.6% in August, versus 8% for non-veterans in that same age group. But among veterans ages 35 to 44, the situation was reversed: Their unemployment rate was 4.8% in August, compared with 2.7% for comparable non-veterans. (The age group data is only available on a non-seasonally adjusted basis.)
Because the age distributions of veterans and non-veterans differ so much, there’s a significant difference in the two groups’ employment-to-population ratios – the share of the total civilian non-institutional population that reports having a job.
For the 18-and-older population, the employment-to-population ratio is consistently higher for non-veterans than for veterans: In August, for instance, 63.3% of non-veterans 18 and over were employed, compared with only 47.3% of veterans. But the veteran figures are pulled down by the large share of those 65 and older, relatively few of whom are in the labor force at all.
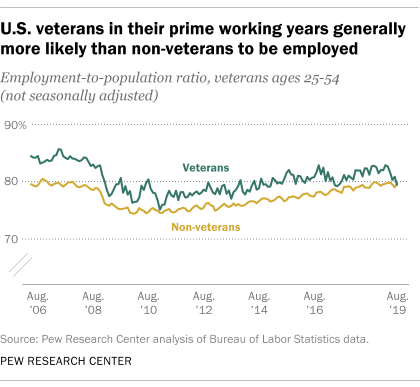
If you compare veterans and non-veterans in the prime working years of 25 to 54, the pattern flips: Since May 2006, when the data series began, working-age veterans almost always have had a higher employment ratio. (Last month, the ratios for the two groups were nearly identical: 79.5% of veterans ages 25 to 54 and 79.7% of non-veterans in that same age bracket were employed.)
Veterans and non-veterans also have somewhat different employment patterns, both in the work they do and the industries they do it in.

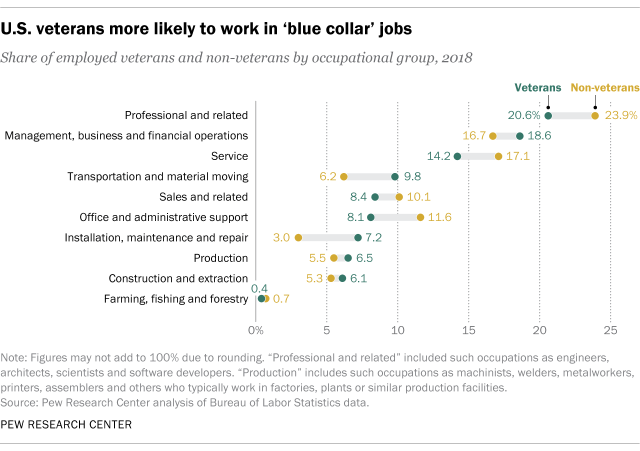
Last year, 7.2% of employed veterans worked in installation, maintenance and repair occupations, versus 3% of employed non-veterans, according to BLS data. Around one-in-ten veterans (9.8%) worked in transportation and material moving occupations, compared with 6.2% of non-veterans. Veterans were somewhat less likely than non-veterans to work in office and administrative support occupations (8.1% vs. 11.6%) and in professional occupations (20.6% vs. 23.9%).
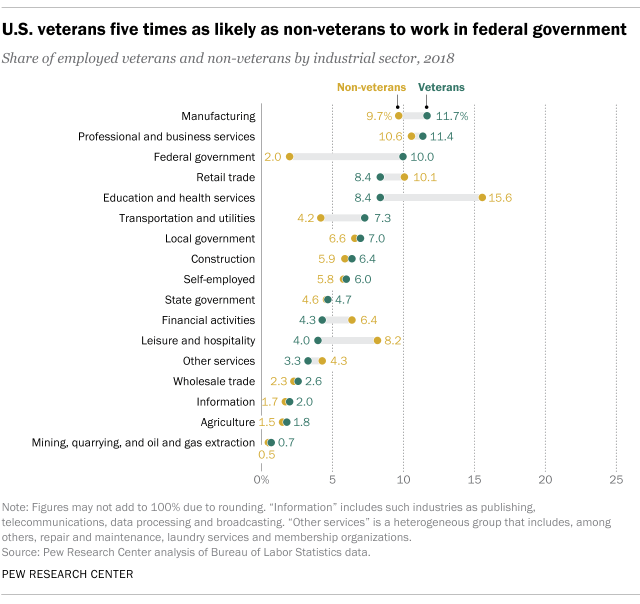
Veterans are far more likely than non-veterans to work for the federal government: 10% of employed veterans did so last year, compared with just 2% of non-veterans. They also were somewhat more likely than non-veterans to work in manufacturing and the transportation and utilities sector.
On the other hand, veterans were notably less likely to work in education and health services: 8.4% of employed veterans worked in that sector last year, compared with 15.6% of non-veterans. They also were less likely than non-veterans to work in leisure and hospitality industries, financial services and retail.

