Every year, Pew Research Center publishes hundreds of reports, blog posts, digital essays and other studies on a wide range of topics, from the demographic and political changes that are reshaping the United States to the attitudes and experiences of people in dozens of other countries. At the end of each year, we compile a list of some of our most noteworthy findings.
Here are 19 striking findings from our research this year:
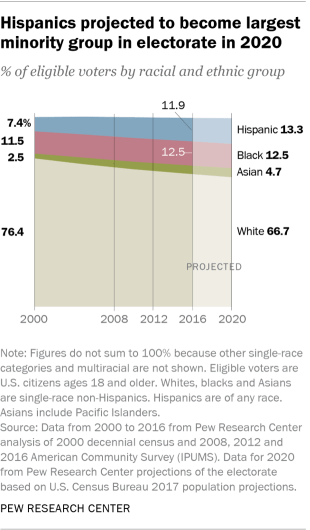
Hispanics are projected to be the largest racial or ethnic minority group in the 2020 U.S. electorate, overtaking the number of black eligible voters for the first time. Hispanics are expected to account for just over 13% of eligible voters, slightly more than the share of black eligible voters.
In absolute numbers, a projected 32 million Hispanics will be eligible to vote in 2020, compared with 30 million black adults. The population of Asians eligible to vote will reach an estimated 11 million, more than double the 5 million who were eligible to vote in 2000. Asians will account for 5% of next year’s electorate. Taken together, nonwhites will account for a third of eligible voters, their largest share ever.
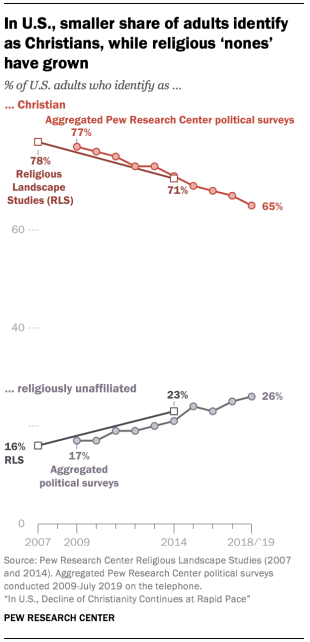
The decline of Christianity is continuing at a rapid pace in the U.S. Around two-thirds of U.S. adults (65%) describe themselves as Christian, according to Pew Research Center telephone surveys conducted in 2018 and 2019. That’s down 12 percentage points since 2009. At the same time, the share of “nones” – religiously unaffiliated adults who describe their religion as atheist, agnostic or “nothing in particular” – has reached 26%, up from 17% a decade ago.
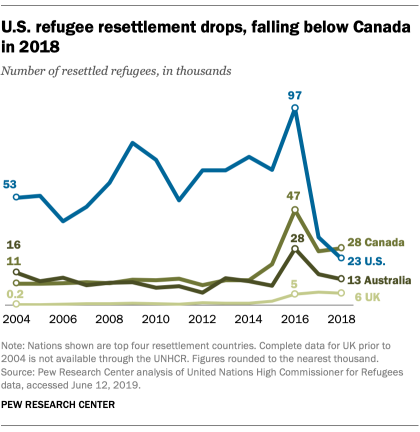
The U.S. no longer leads the world in admitting refugees. Canada resettled more refugees than the U.S. did in 2018, marking the first time the U.S. did not lead the world on this measure since Congress created the nation’s refugee program in 1980. While Canada resettled 28,000 refugees in 2018 – similar to its total in 2017 – the U.S. resettled 23,000, down from 33,000 the year before and far below a recent high of 97,000 in 2016. The U.S. had previously admitted more refugees each year than all other countries combined.
Looking ahead, the number of refugees resettled in the U.S. is likely to decrease further: The Trump administration set a new cap of 18,000 refugees in the 2020 fiscal year.
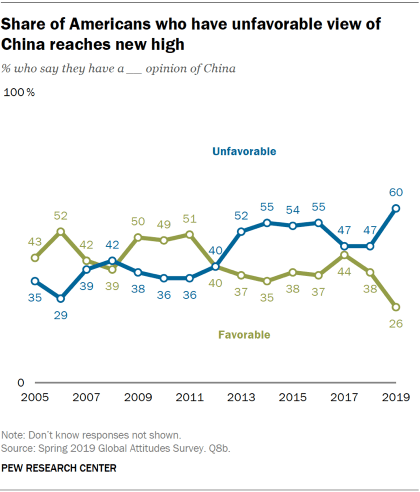
The share of Americans with an unfavorable view of China reached a 14-year high amid a protracted trade dispute between the two countries. Six-in-ten U.S. adults have a negative opinion of China, up from 47% in 2018 and the highest share since Pew Research Center began asking Americans this question in 2005.
Americans also increasingly see China as a threat. Around a quarter of Americans (24%) name China as the country or group that poses the greatest threat to the U.S. in the future, double the share who said this in 2007. China is tied with Russia (24%) as the country or group most cited by Americans as a threat to the U.S.; the only other country to measure in the double digits is North Korea (12%).
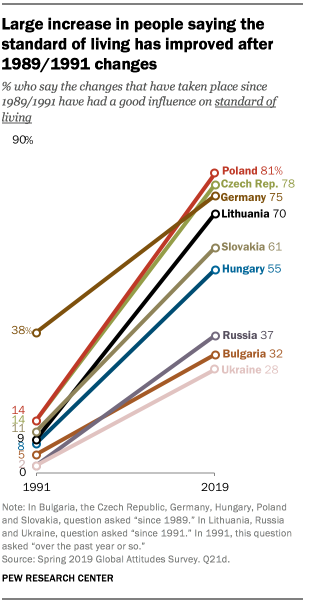
Three decades after the fall of the Berlin Wall, people in many former communist countries in Europe see greatly improved standards of living. Since 1991, there have been large increases in the share of adults who think the changes that swept through the region in 1989 and 1991 have had a good influence on living standards in their country. In Poland, for example, only 14% of people said in 1991 that the recent changes had had a positive influence on living standards. By 2019, that figure had shot up to 81%, more than a fivefold increase. In Lithuania, the share saying this has soared from just 9% in 1991 to 70% this year.
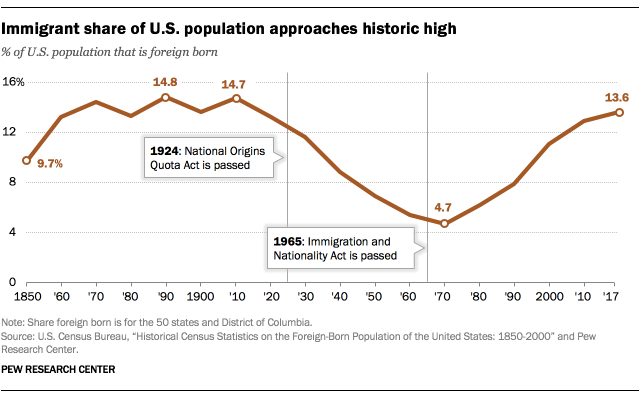
The foreign-born share of the U.S. population is at its highest point since 1910. Nearly 14% of people living in the U.S. in 2017 were born in another country, extending a steady increase over the past few decades. In absolute numbers, more than 44 million immigrants lived in the U.S. – more than in any other country in the world.
The foreign-born share of the U.S. population, however, is far from the highest in the world. In 2017, 25 countries and territories had higher shares of foreign-born people than the U.S., including Australia (29%), New Zealand (23%) and Canada (21%), as well as European countries such as Switzerland (30%), Austria (19%) and Sweden (18%).
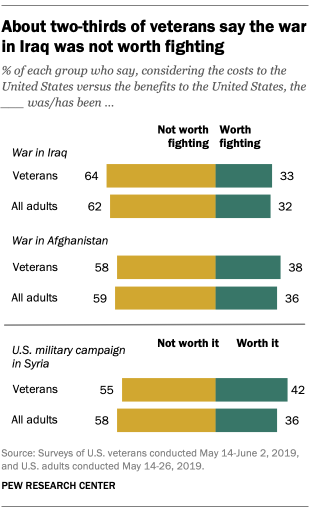
Majorities of U.S. military veterans – as well as the broader U.S. public – say the wars in Iraq and Afghanistan were not worth fighting. Among veterans, 64% say the war in Iraq was not worth fighting, while 58% say the same about the war in Afghanistan.
The American public holds similar views: 62% and 59% of U.S. adults, respectively, say the wars in Iraq and Afghanistan were not worth it, considering the costs and the benefits. When asked about the U.S. military campaign in Syria, 55% of veterans and 58% of the public say the campaign has not been worth it.
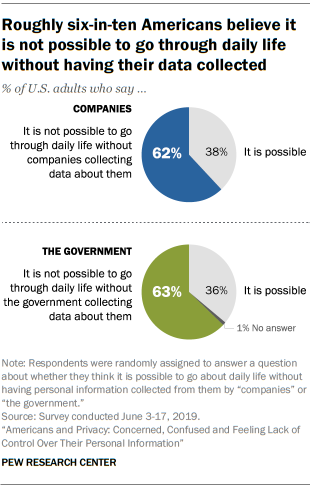
A majority of Americans do not think it is possible to go about daily life without corporate and government entities collecting information about them. Americans widely believe at least some of their online and offline activities are being tracked and monitored by companies and the government. It is such a common condition of modern life, in fact, that roughly six-in-ten U.S. adults say they don’t think it is possible to go through daily life without having data collected about them by companies (62% say this) or the government (63%).
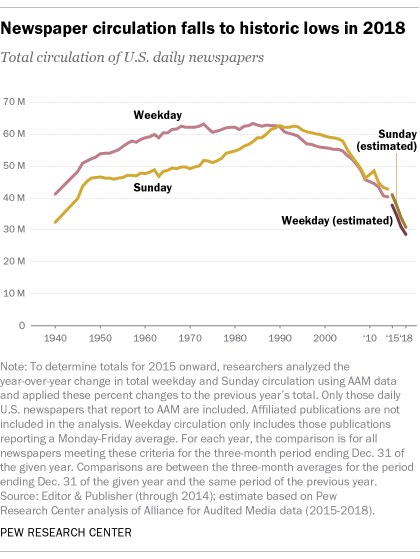
U.S. newspaper circulation has fallen to its lowest level since at least 1940, the earliest year with available data. Total daily newspaper circulation – print and digital combined – was an estimated 28.6 million for weekday and 30.8 million for Sunday in 2018. Those numbers were down 8% and 9%, respectively, from the previous year and are now below their lowest recorded levels (though weekday circulation first passed this threshold in 2013).
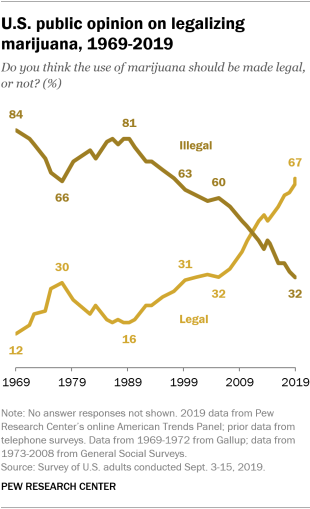
Two-thirds of Americans support the legalization of marijuana, a dramatic reversal from two decades ago. Legalizing the drug – which remains banned under federal law – has the backing of a majority of men and women; white, black and Hispanic adults; and Democrats and Democratic-leaning independents and Republicans and Republican leaners (though Democrats remain far more likely than Republicans to favor it, 78% vs. 55%).
Meanwhile, an overwhelming majority of U.S. adults (91%) say marijuana should be legal for medical and recreational use (59%) or that it should be legal just for medical use (32%). Fewer than one-in-ten (8%) prefer to keep marijuana illegal in all circumstances.
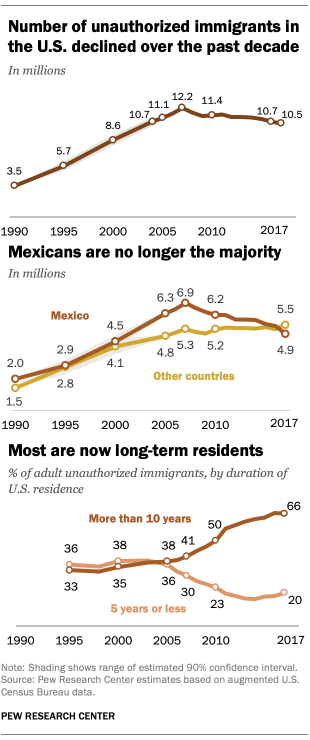
The number of people living in the U.S. without authorization has decreased over the past decade, driven by a sharp decline in unauthorized immigrants from Mexico. As a result, Mexicans no longer account for the majority of unauthorized immigrants in the country. In 2007, there were 12.2 million unauthorized immigrants in the U.S., including 6.9 million Mexicans. By 2017, there were 10.5 million unauthorized immigrants, including 4.9 million Mexicans.
While the number of unauthorized immigrants from Mexico has decreased, the numbers from two regions – Asia and Central America – have risen. Overall, there were 5.5 million unauthorized immigrants from countries other than Mexico in 2017, compared with 5.3 million in 2007.
One reflection of the changing migration patterns is at the U.S.-Mexico border, where apprehensions of non-Mexican migrants vastly outnumbered those of Mexicans in the 2019 fiscal year (80% vs. 20%). In 2000, by comparison, non-Mexicans accounted for just 2% of apprehensions at the southwest border, while Mexicans accounted for 98%.
Roughly six-in-ten Americans (63%) say the legacy of slavery still affects black people in the U.S. today. This is particularly the case for black Americans, 84% of whom say the legacy of slavery affects the position of black people in the U.S. today either a great deal (59%) or a fair amount (25%).
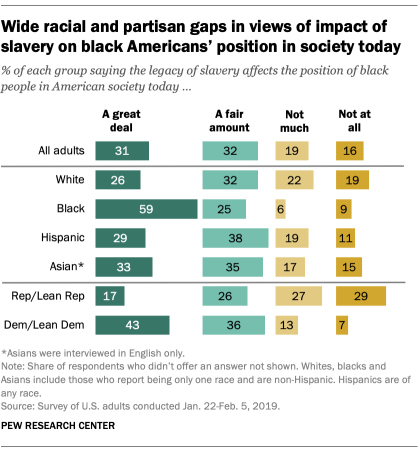
By comparison, 26% of whites, 29% of Hispanics and 33% of Asians say the legacy of slavery affects the position of black people in American society a great deal, though majorities in each group say it does so at least a fair amount. This year marked the 400th anniversary of the arrival of the first slave ship in Jamestown, Virginia.
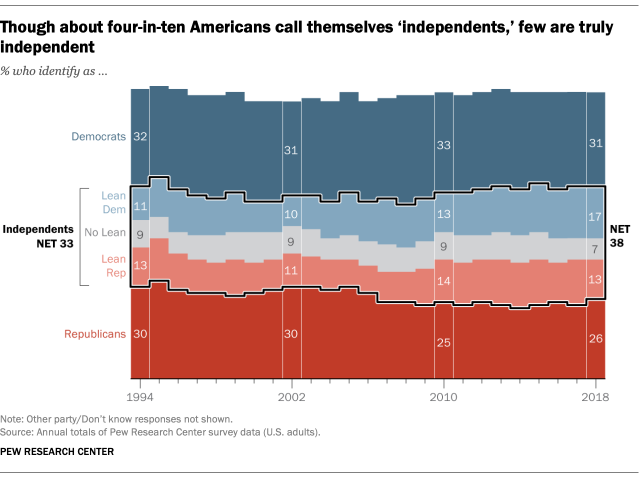
Political independents who don’t lean toward one party or the other account for only 7% of Americans. While they are often portrayed as political free agents with the potential to bridge the nation’s rigid partisan divisions, most independents are not all that “independent” politically. An overwhelming majority of independents (81%) “lean” toward either the Republican Party or the Democratic Party. And the small share of Americans who don’t lean toward either party stand out for their low level of interest in politics.
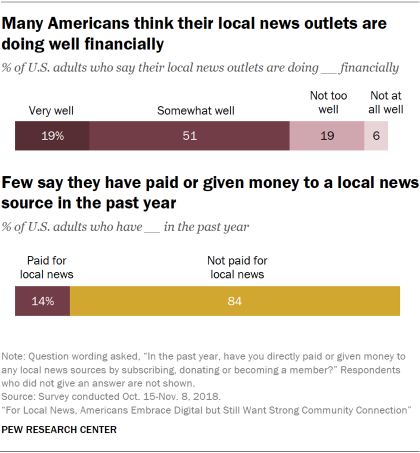
Despite the economic troubles facing the news industry, about seven-in-ten Americans (71%) believe their local news media organizations are doing well financially. This belief persists even though only 14% of U.S. adults say they personally have paid for local news within the past year, whether through subscriptions, donations or memberships. When asked why they don’t pay for local news, around half of non-payers (49%) point to the widespread availability of free content.
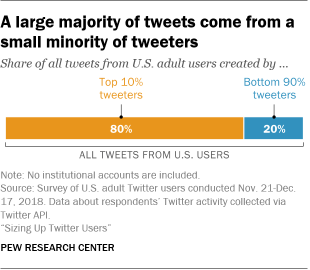
The most active 10% of adult Twitter users in the U.S. produce 80% of all tweets sent by these users. The median adult user of the platform tweets just twice a month, but a small group tweets much more frequently, according to our April study. There was an even starker pattern in a follow-up study that looked specifically at tweets about national politics. In that study, 97% of tweets that were created by U.S. adults and mentioned national politics came from just 10% of users.
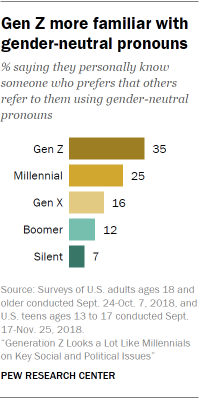
Roughly a third of Gen Zers (35%) say they know someone who prefers to be referred to using gender-neutral pronouns. Gen Zers (Americans born after 1996) are more likely than Millennials (born between 1981 and 1996) to say they know someone who prefers this: 35% say this is the case, compared with a quarter of Millennials and smaller shares in older generations.
The youngest generation is also the most likely to say that forms or online profiles that ask about a person’s gender should include options other than “man” or “woman.” Roughly six-in-ten Gen Zers (59%) hold this view, compared with half of Millennials and four-in-ten or fewer Gen Xers (born 1965 to 1980), Baby Boomers (1946 to 1964) and members of the Silent Generation (born 1928 to 1945).
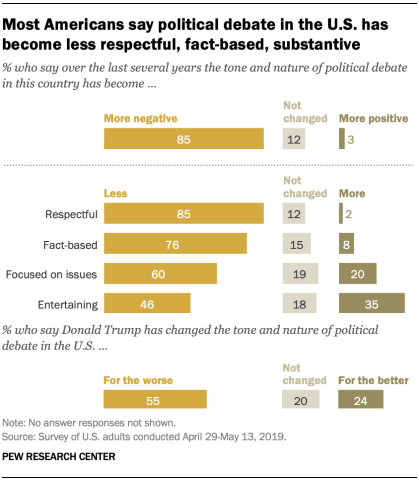
The U.S. public renders a harsh judgment on the state of political discourse in the country today. Large majorities of Americans say the tone and nature of political debate has become more negative in recent years, as well as less respectful, less fact-based and less substantive. President Donald Trump is a major factor in people’s views: A 55% majority says Trump has changed the tone and nature of political debate in the country for the worse. Fewer than half as many (24%) say he has changed it for the better, while 20% say he has had little impact.
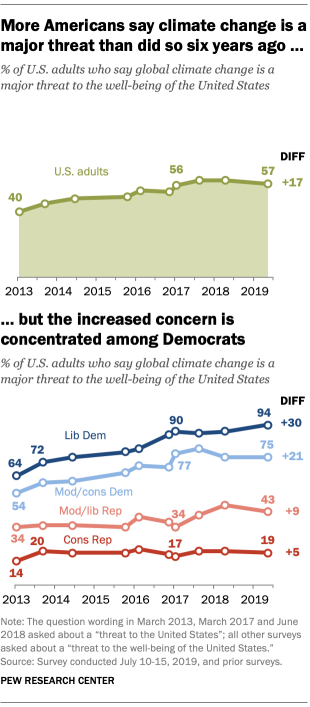
Concerns about climate change have risen in the U.S., but most of the change has come among Democrats. The share of Americans who see global climate change as a major threat to the well-being of the U.S. has increased from 40% in 2013 to 57% this year, but Republican attitudes about this have changed little. Around a quarter of Republicans and Republican-leaning independents (27%) now say climate change is a major threat, about the same as the 22% who said this in 2013. Among Democrats and Democratic leaners, by contrast, 84% say global climate change is a major threat, up from 58% in 2013.
Nearly all liberal Democrats (94%) consider climate change a major threat to the nation, up 30 percentage points from 2013. Three-quarters of moderate and conservative Democrats also say this, up from 54% in 2013. By contrast, there has been no statistically significant change among either moderate or conservative Republicans.
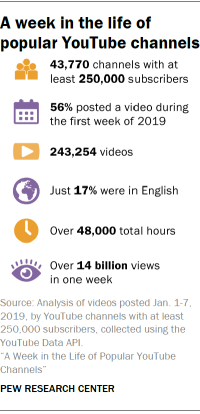
A single person watching YouTube videos for eight hours a day with no breaks or days off would need more than 16 years to watch all the content posted by just the most popular channels on the platform during a single week. These popular channels – defined as those with at least 250,000 subscribers – posted nearly a quarter-million videos in the first seven days of 2019, totaling 48,486 hours of content. The average video on these channels was roughly 12 minutes long and received 58,358 views during its first week on the site. Altogether, these videos were viewed over 14.2 billion times in their first seven days.
