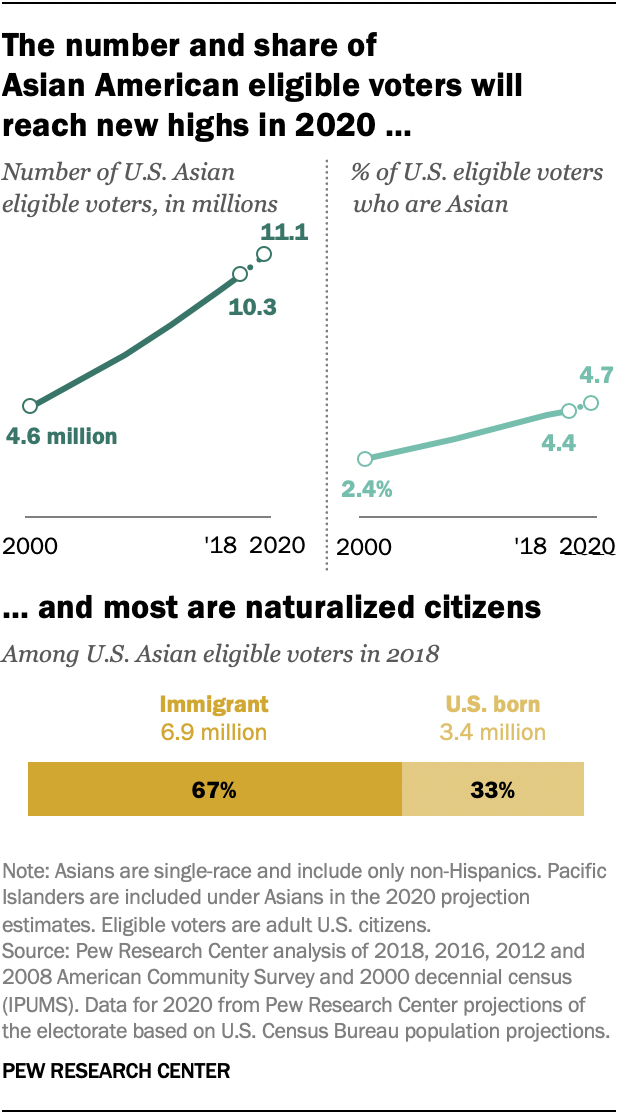
Asian Americans are the fastest-growing segment of eligible voters out of the major racial and ethnic groups in the United States. More than 11 million will be able to vote this year, making up nearly 5% of the nation’s eligible voters (for this analysis, U.S. citizens ages 18 and older). They are also the only major racial or ethnic group in which naturalized citizens – rather than the U.S. born – make up a majority of eligible voters, according to a Pew Research Center analysis of Census Bureau data.
From 2000 to 2020, the number of Asian American eligible voters more than doubled, growing by 139%. The Hispanic electorate grew at a similar rate (121%), but the black and white electorates grew far more slowly (33% and 7%).
How we did this
This post is part of a continuing exploration of eligible voters in the United States. For this project, we analyzed the detailed demographics and geographic distribution of Asian Americans who are eligible to vote in the 2020 presidential election. In this analysis, Asians are identified as people who report their race to be Asian or any detailed Asian group, such as Chinese, Japanese or Pakistani, but do not include people who self-identify only as Pacific Islanders. The term “eligible voters” refers to persons ages 18 and older who are U.S. citizens. All mentions of the Asian, black and white electorates refer to their single race and non-Hispanic populations. Hispanic eligible voters are of any race.
The analysis is based on data from the U.S. Census Bureau’s American Community Survey and the 2000 U.S. decennial census provided through Integrated Public Use Microdata Series (IPUMS) from the University of Minnesota. Data on political party affiliation is from AAPI Data’s 2018 Asian American Voter Survey.
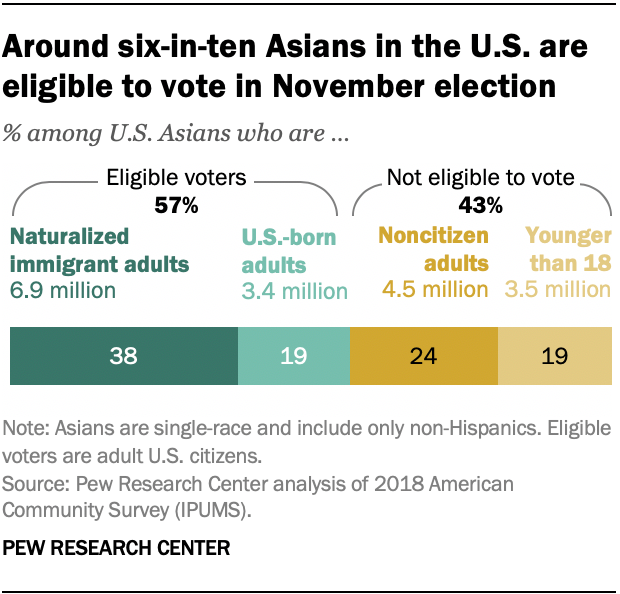
Even though Asian Americans are projected to make up a record high 4.7% of U.S. eligible voters this year, the share is still lower than their proportion of the nation’s total population (5.6%). The difference is partly due to the 4.5 million adult immigrant Asians who are not citizens and are therefore unable to vote. This group includes permanent residents (green card holders) and those in the process of becoming permanent residents; those in the U.S. on temporary visas; and unauthorized immigrants. These groups make up about a quarter of the overall Asian population in the U.S. (24%). Another 3.5 million Asians in the U.S., or 19% of their total population, are under the age of 18, making them ineligible to vote. Altogether, about six-in-ten (57%) of the nation’s 18.2 million U.S. Asians are eligible voters.
Demographics and party affiliation of Asian American eligible voters
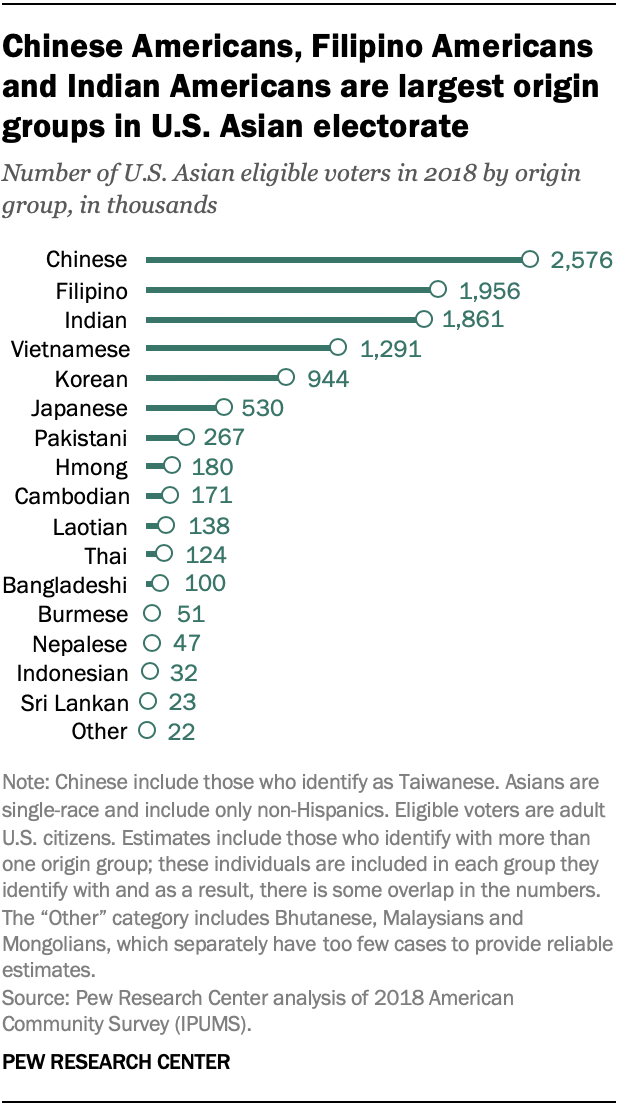
The U.S. Asian electorate is a diverse group, with eligible voters tracing their roots to countries in East and Southeast Asia and the Indian subcontinent. Just six origin groups – Chinese, Filipino, Indian, Vietnamese, Korean and Japanese – account for the majority of U.S. Asian voters. This pattern closely mirrors the Asian American population as a whole: The same six origin groups make up 85% of all U.S. Asians.
A 2018 survey by AAPI Data found that party identification varies by origin group. For example, Vietnamese Americans are more likely than Asian Americans overall to identify as Republican (42% vs. 28%). By contrast, Indian Americans are the most likely to be Democrats of any Asian origin group, with 50% identifying as Democrats and just 18% as Republican.
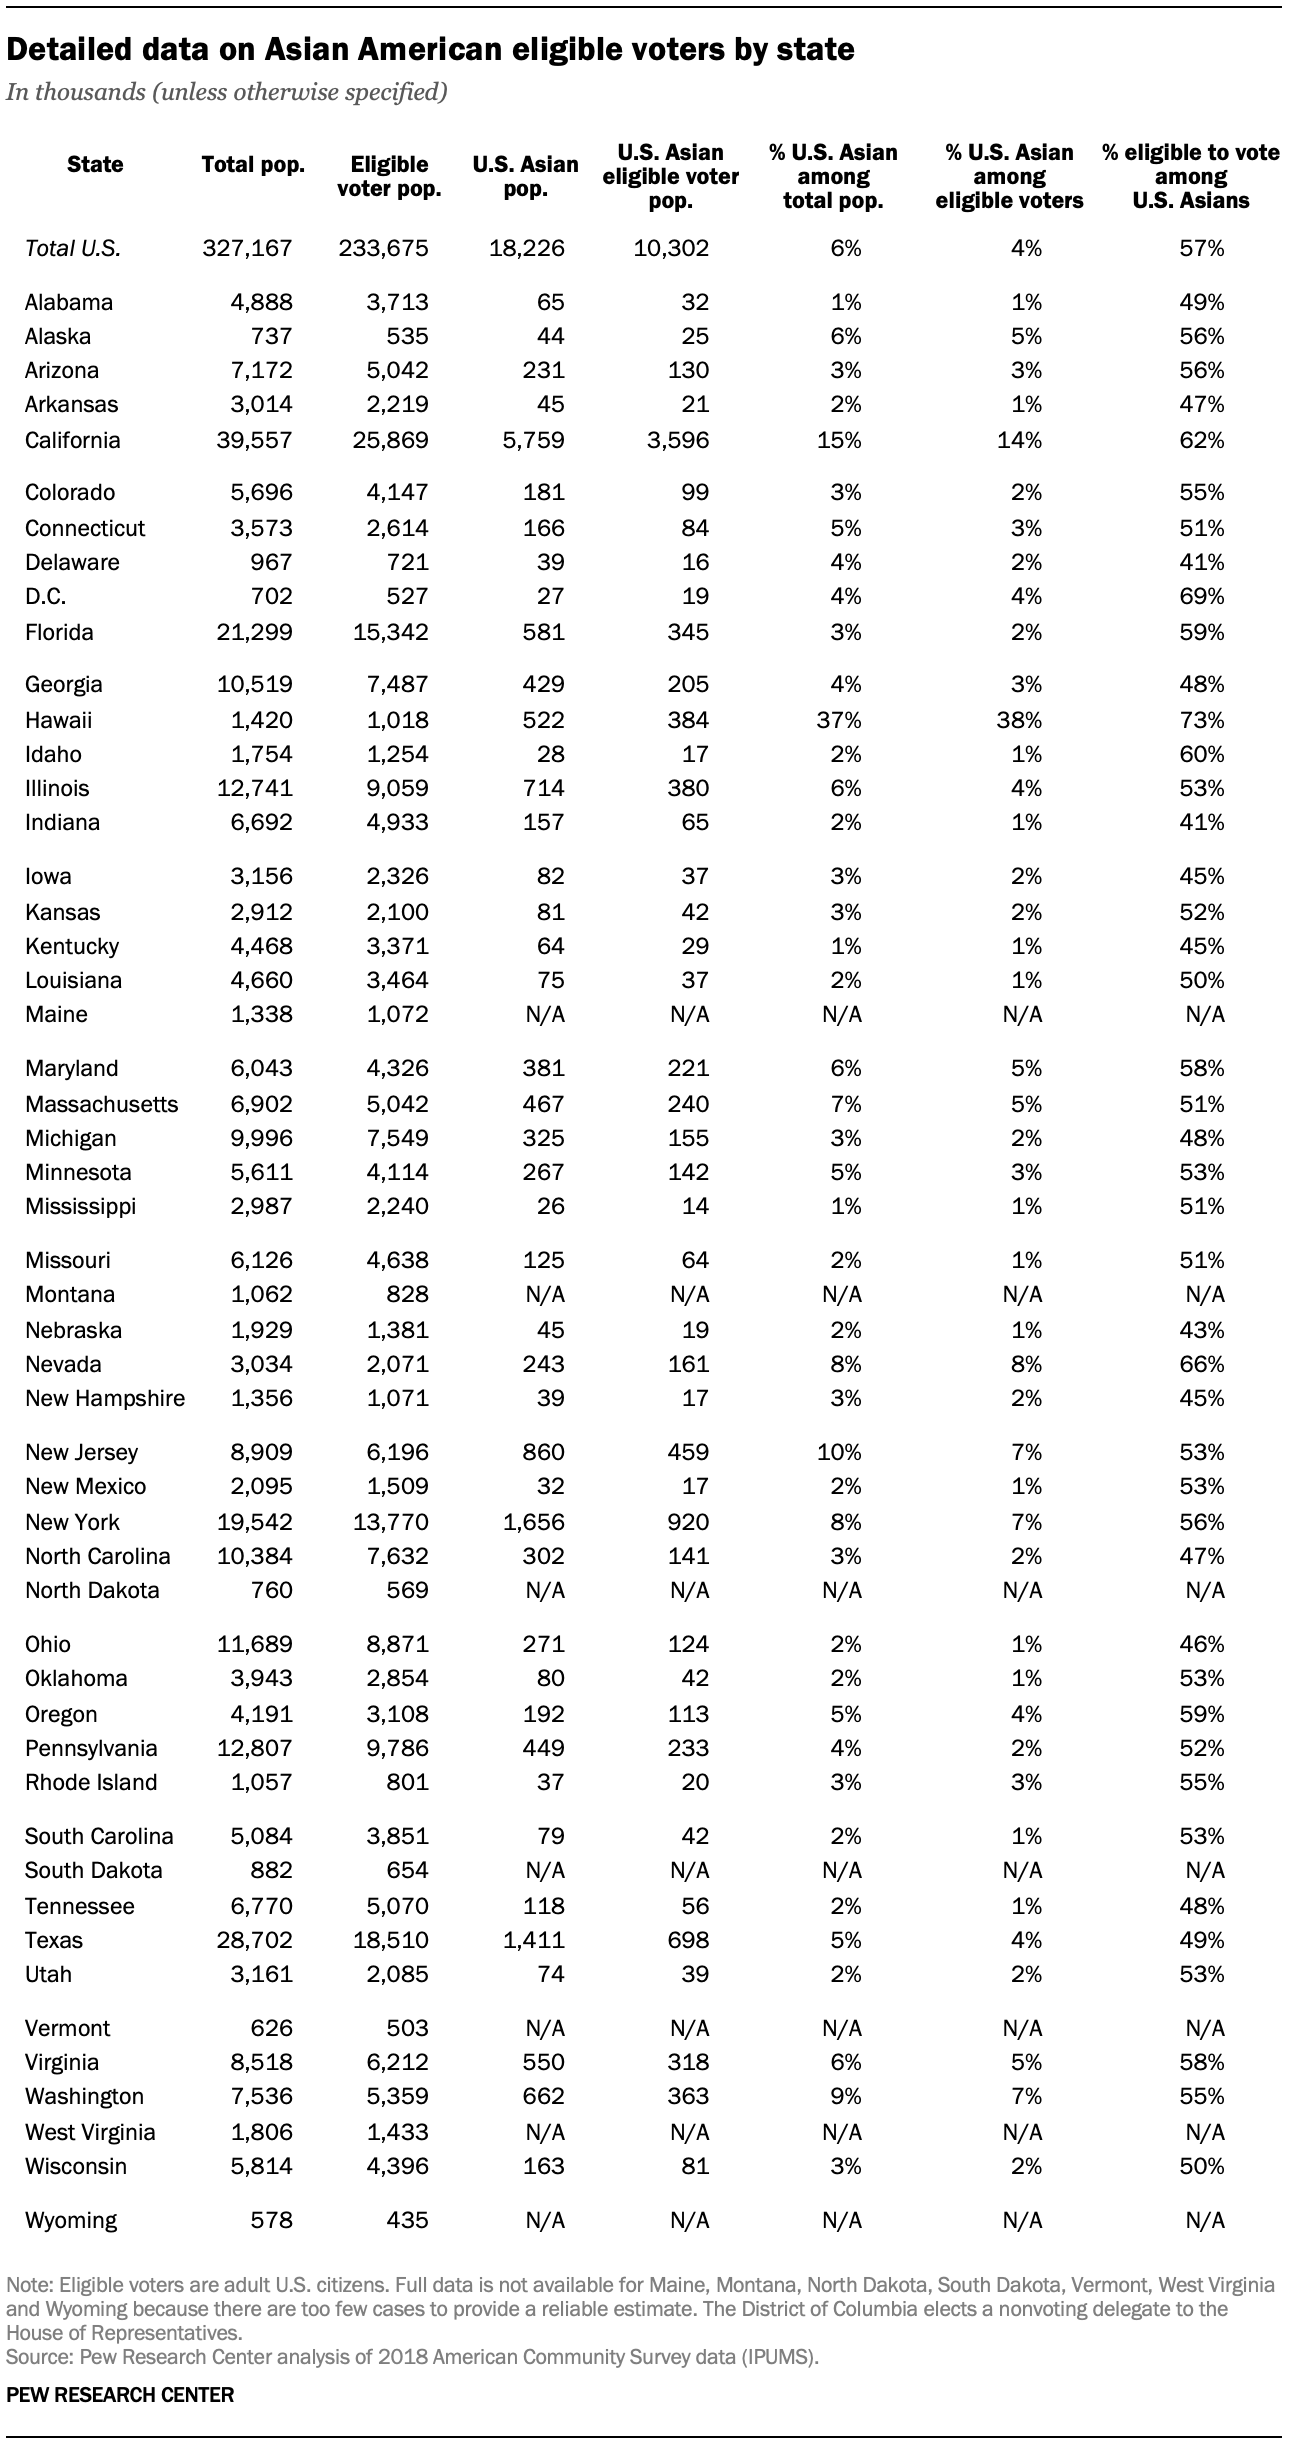
Asian American eligible voters are dispersed throughout the country, but more than half live in only three states. California alone holds 35% of the U.S. Asian electorate (3.6 million). The state with the second-most Asian American eligible voters is New York (920,000), followed by Texas (698,000).
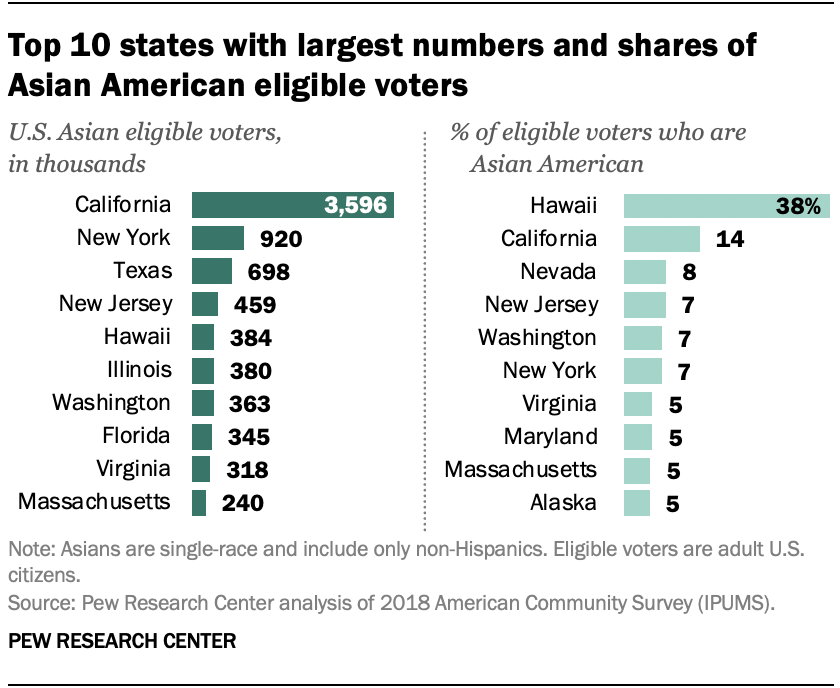
Meanwhile, only in Hawaii do Asian Americans account for a larger share of eligible voters than any racial or ethnic group. They make up 38% of the state’s eligible voters, by far the highest share in the country. California has the next highest share with 14%.
Hawaii is also the state where the highest share of Asian Americans is eligible to vote (73%). It is followed by the District of Columbia (69%), Nevada (66%) and California (62%).
U.S. Asian eligible voters stand out from those in other racial and ethnic groups in a number of ways. About seven-in-ten (71%) report speaking only English at home or say they speak English “very well” – lower than the share who say this among Hispanic (80%), black (98%) and white (99%) eligible voters.
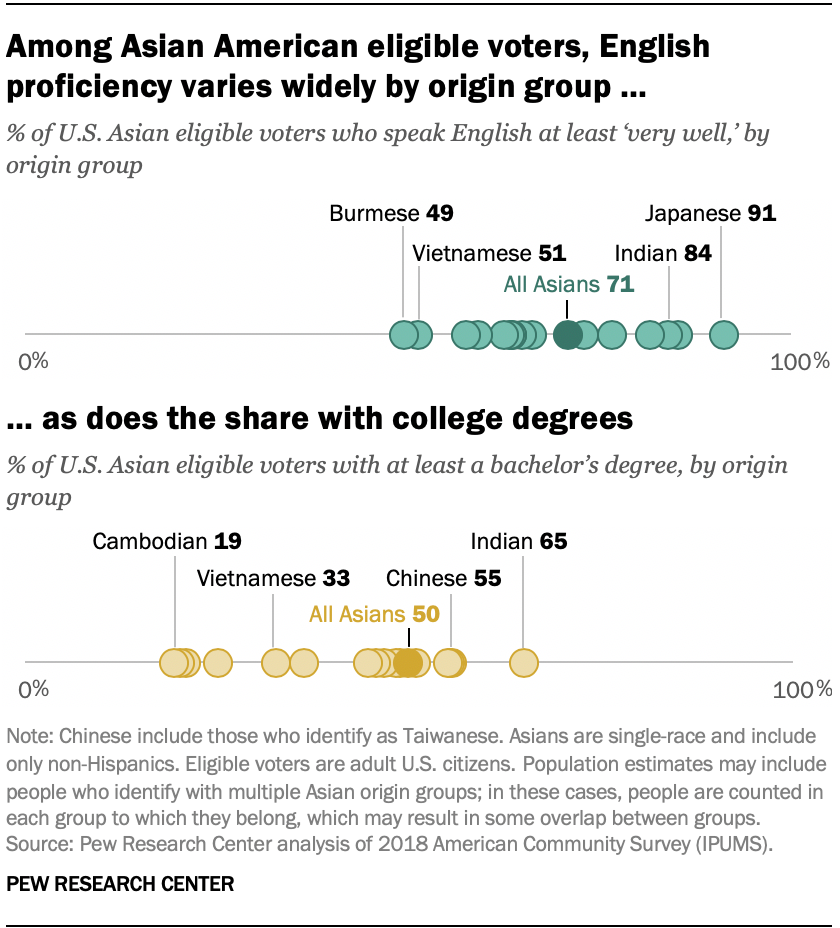
But there is considerable variation in English proficiency by origin group. The vast majority (91%) of Japanese American eligible voters say they speak English at least “very well.” Among Burmese American eligible voters, by contrast, only about half (49%) say the same. The backgrounds of these two origin groups may help explain the disparity. Most Japanese Americans (80%) are U.S. born, while most U.S. Burmese (85%) are immigrants, many of whom are recent arrivals and entered the country as refugees.
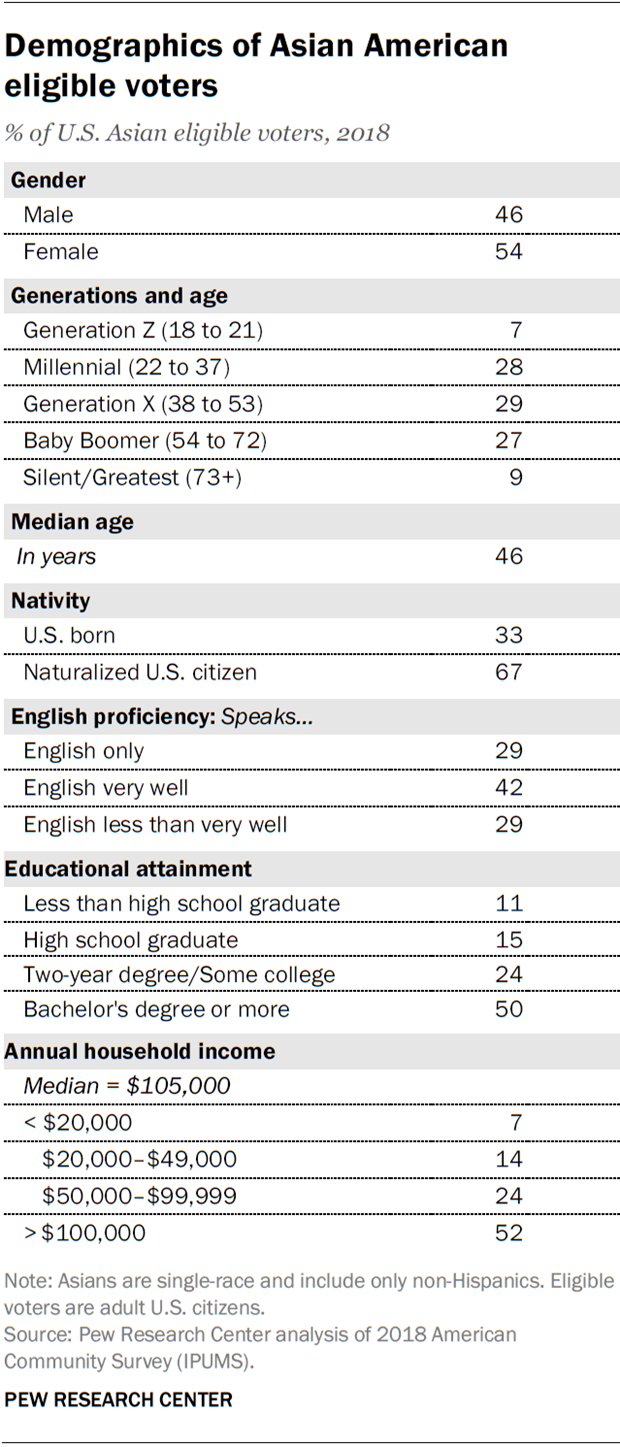
Among eligible voters, Asian Americans have the highest levels of educational attainment of any major racial and ethnic group. Half (50%) have a bachelor’s degree or more, a higher share than white (34%), black (20%) or Hispanic (18%) eligible voters.
Educational attainment varies widely among different U.S. Asian origin groups. Indian American eligible voters are by far the most likely to have at least a bachelor’s degree (65%). By comparison, only 19% of Cambodian American eligible voters have the same level of education, the lowest share of any Asian American origin group.
U.S. Asian eligible voters have an annual median household income of $105,000, the highest of any racial or ethnic group. White, Hispanic and black eligible voters all have median household incomes below $80,000.
Among Asian American origin groups, U.S. Indian eligible voters ($139,000) have the highest median household income, while Burmese Americans ($69,000) have the lowest.
The median age of Asian American eligible voters is 46, making them older than black (44) and Hispanic (38) eligible voters but younger than white voters (51). However, age among Asian American voters differs widely between those who are U.S. born and foreign born. U.S.-born Asian eligible voters are 20 years younger at the median than those born abroad (31 vs. 51).
Within the U.S. Asian electorate, Hmong Americans are the youngest group, with a median age of 32. Japanese Americans are the oldest, with a median age of 59.
View a detailed table of Asian eligible voters by state below (or open as a PDF).
Asian American eligible voters by state
