Note: This post has been updated with new Florida statewide Hispanic voter registration totals that reflect final tallies.
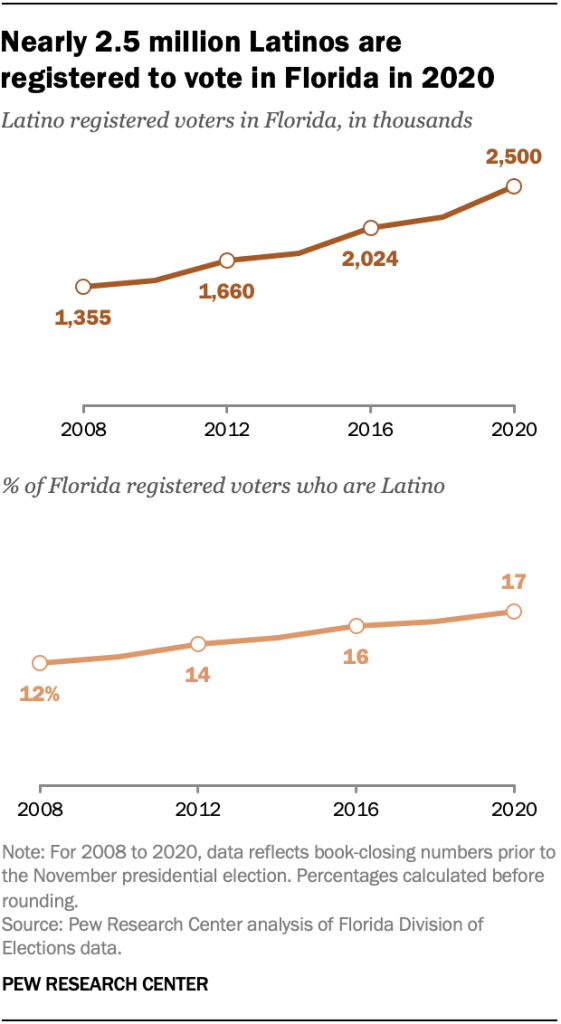
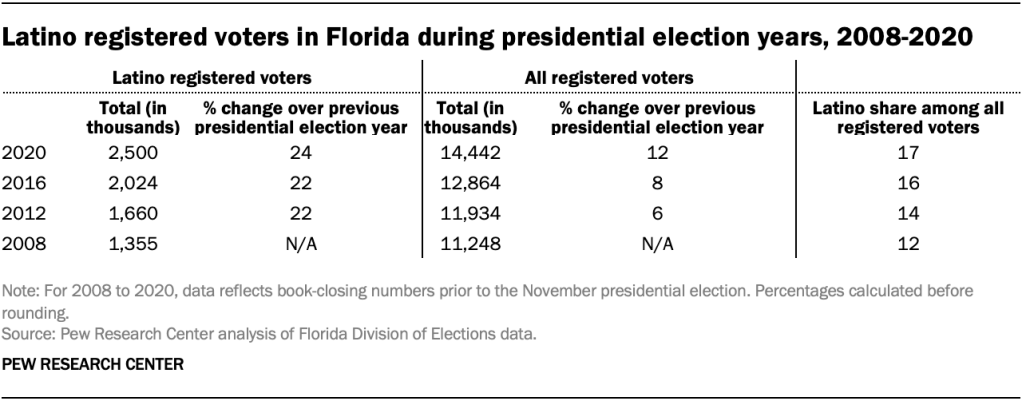
About 2.5 million Latinos are registered to vote in Florida for the 2020 presidential election, making up a record 17% of the state’s total. This is up from 2016, when about 2 million Latinos were registered to vote, accounting for 16% of Florida’s registered voters, according to a Pew Research Center analysis of Florida state government data.
Nearly 476,000 additional Hispanics are registered to vote in Florida in 2020 compared with 2016, accounting for 30% of the state’s overall growth in registered voters during that span. This increase eclipses Hispanic voter growth in previous election cycles. For example, the number of Hispanic registered voters in Florida grew by 364,000 between 2012 and 2016 and by 305,000 between 2008 and 2012 – the last time an incumbent president was up for reelection. These figures are as of Florida’s “book closing” date on Oct. 6 and represent final voter registration figures for the Nov. 3 general election.)
Once again, Florida is a battleground state in a presidential election. The state has the largest Latino electorate among all battleground states and the third-largest Latino electorate overall (3.1 million eligible voters), trailing only California (7.9 million) and Texas (5.6 million).
For this report, we analyzed the number of Hispanics registered to vote in Florida, including their distribution by county, based on data from the Florida Division of Elections.
We also analyzed the demographics of Hispanic eligible voters in Florida. The term “eligible voters” refers to people ages 18 and older who are U.S. citizens. The analysis is based on data from the U.S. Census Bureau’s 2008 and 2018 American Community Surveys provided through Integrated Public Use Microdata Series (IPUMS) from the University of Minnesota.
The Latino share of Florida’s electorate rose by 9 percentage points between 2000 and 2018, from 11% of eligible voters to 20%. Nationally, a record 32 million Latinos are eligible to vote in 2020. (It’s important to keep in mind that eligible voters are not the same as registered voters. Eligible voters are adult U.S. citizens, but not all eligible voters are registered to vote. The most recent available detailed data on the number of eligible voters in Florida is for 2018.)
Democrats widen advantage over Republicans among Hispanic registered voters
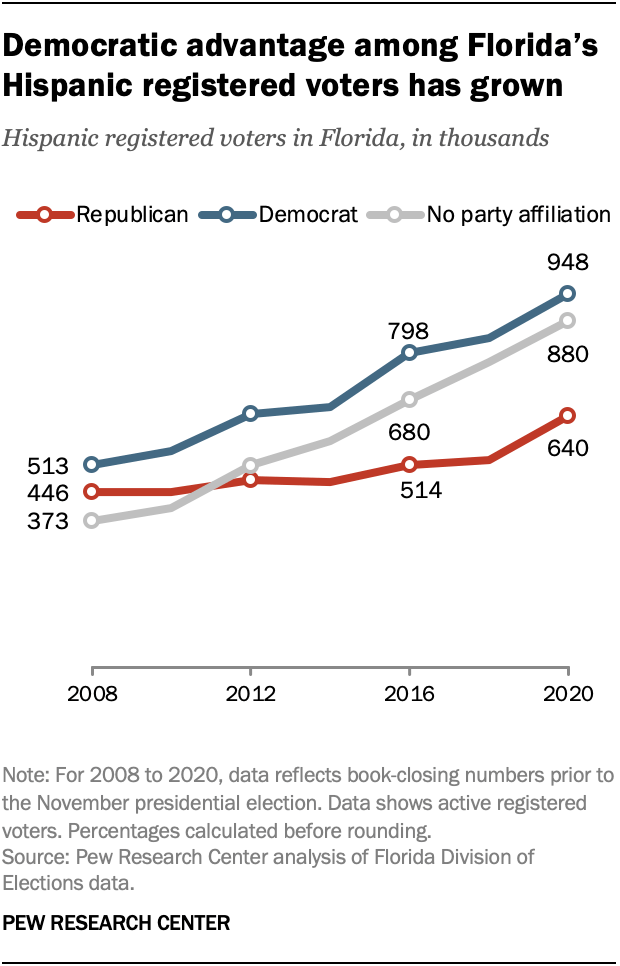
Democrats outnumber Republicans among Hispanic registered voters in Florida, and this gap has widened since 2016. This year, about 948,000 Hispanic voters are registered as Democrats (amounting to about 38% of the Hispanic total in Florida), while roughly 640,000 are registered as Republicans (26% of the total). An additional 880,000 Hispanic Floridians are registered with no party affiliation (35% of the total).
This year’s Democratic advantage of around 308,000 Hispanic registered voters is up from an advantage of 284,000 four years ago. In 2016, 798,000 Hispanics in Florida were registered Democrats while 514,000 were registered Republicans.
Since 2016, the number of Hispanic Florida voters who are registered as Democrats has risen by 149,000, compared with an increase of 126,000 among Republicans. But the biggest increase during this period has been among those who are registered with no party (+200,000).
The recent trend in party registration among Hispanic Floridians stands in contrast to the pattern among all Floridians. More Florida residents have registered to vote as Republicans than Democrats since 2016.
It is uncertain how these patterns will affect the upcoming presidential election. Florida has seen competitive elections in recent years, including those for president and state offices.
Miami-Dade County has most Hispanic registered voters, but fastest growth is elsewhere
There are 915,000 Hispanic registered voters in Miami-Dade County, or 37% of the state’s Hispanic total. Broward County follows with 11%, while Orange (9%), Hillsborough (7%) and Palm Beach (5%) round out the top five counties.
Hispanics account for 58% of all registered voters in Miami-Dade County, the largest share of any Florida county. Roughly half (48%) of registered voters in Osceola County are Hispanic, the second largest share in the state.
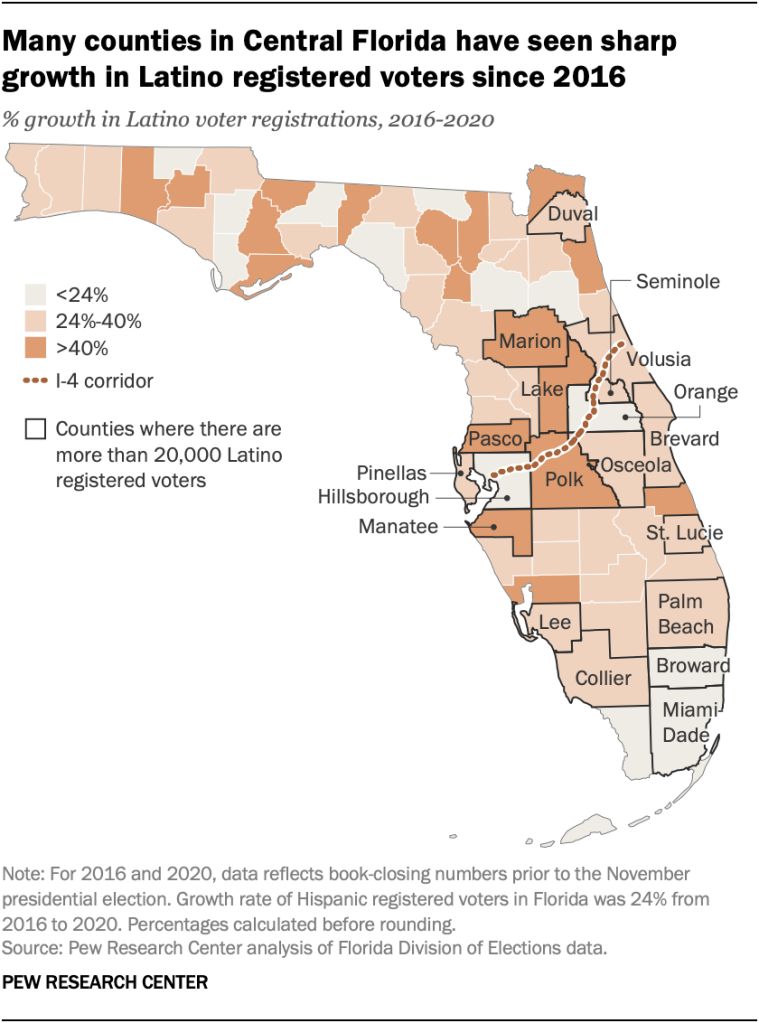
Yet when it comes to growth in the number of Hispanic registered voters over the past four years, other counties stand out. The number of Latinos registered to vote in Polk County grew by 54% from 2016 to 2020, the fastest growth among counties with at least 20,000 Latino registered voters in 2020 – and far faster than the statewide increase (+24%).
Fourteen other counties also exceeded the statewide growth rate in Latino voter registrations from 2016 to 2020. They include Lake (+49%), Pasco (+47%), Manatee (+43%), Marion (+41%) and Lee (+40%) counties. Overall, these 15 counties with large Latino registered voter populations grew faster than the state average, accounting for roughly 41% of the state’s increase in Latino registered voters since 2016. Many of these counties are in Central Florida, where Puerto Ricans make up the largest Latino origin population, according to a Pew Research Center analysis of U.S. Census Bureau data.
Cubans remain the largest Hispanic origin group electorate
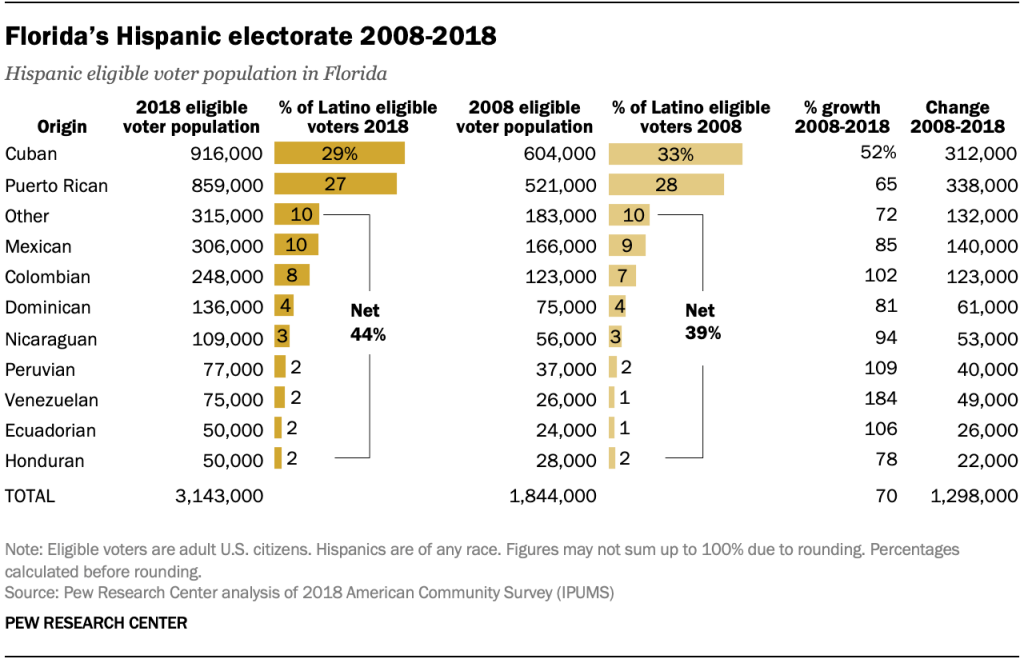
Cuban Americans (29%) and Puerto Ricans (27%) are Florida’s two largest Hispanic origin groups when looking at eligible voters.
But as the state’s Hispanic population has grown more diverse over time, so too has its Hispanic electorate. Both Cuban Americans and Puerto Ricans have decreased as a share of Florida’s Latino electorate since 2008, while the share of those from other origin groups has increased (from 39% to 44% of eligible voters).
The number of Venezuelan eligible voters in Florida grew by 184% from 2008 to 2018 – the fastest growth of any Latino origin group, though they still only account for 2% of all Hispanic eligible voters in the state. Other groups that grew considerably faster than the statewide average include Peruvians (+109%), Ecuadorians (+106%) and Colombians (+102%). Again, however, each of these groups still makes up a relatively small share of the state’s Latino electorate (8% or less).
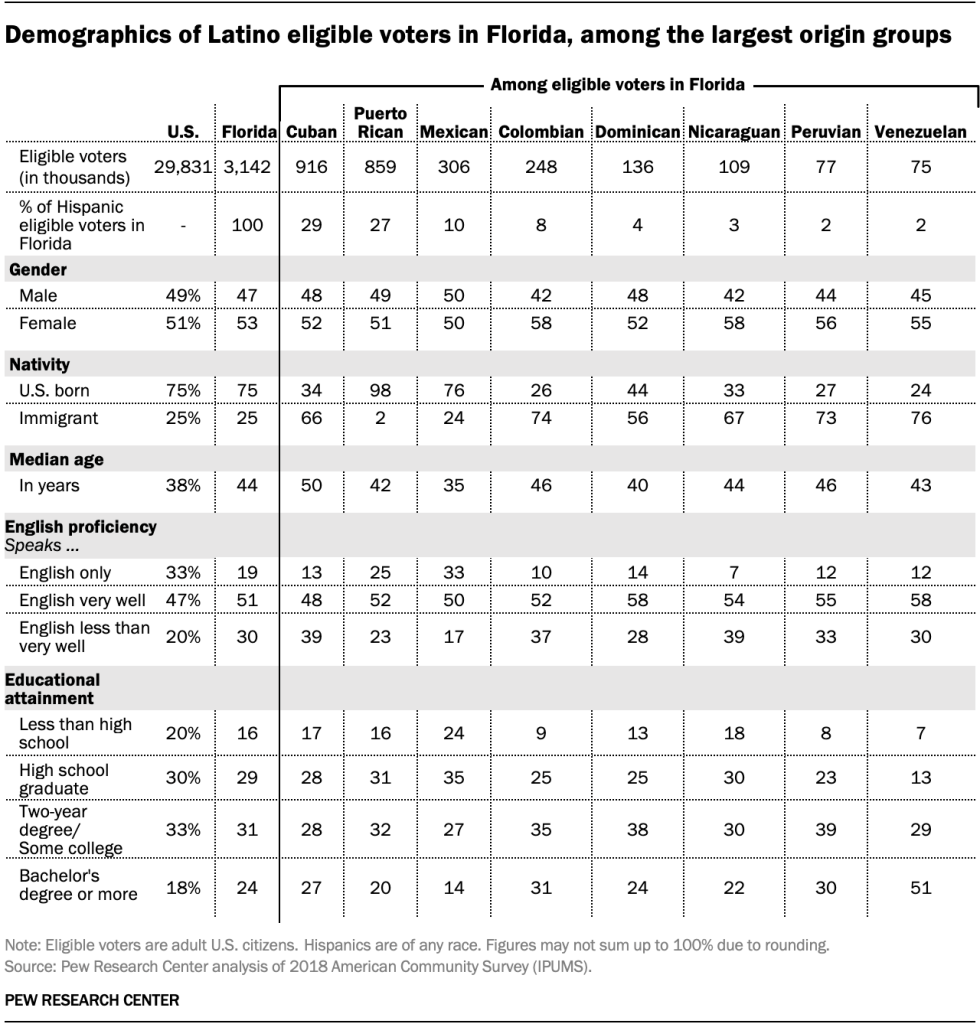
Compared with Latino eligible voters in the United States as a whole, those in Florida are more likely to be immigrants, younger and college graduates. They are also less likely to be proficient in English. (See table below for more information.)
But Florida’s Latino eligible voters are far from a monolith in terms of their background. For example, while 76% of Venezuelan and 74% of Colombian eligible voters were naturalized citizens as of 2018, the share was much lower among Mexicans (24%).
Note: This is an update of a post originally published Oct. 14, 2020.
