More than 30 years after the debut of the World Wide Web, internet use, broadband adoption and smartphone ownership have grown rapidly for all Americans – including those who are less well-off financially. However, the digital lives of Americans with lower and higher incomes remain markedly different, according to a Pew Research Center survey of U.S. adults conducted Jan. 25-Feb. 8, 2021. In fact, the shares of Americans in each income tier who have home broadband or a smartphone have not significantly changed from 2019 to 2021.
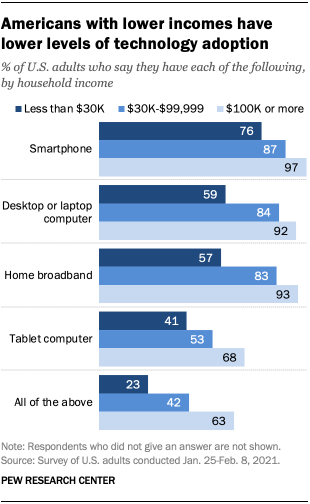
Roughly a quarter of adults with household incomes below $30,000 a year (24%) say they don’t own a smartphone. About four-in-ten adults with lower incomes do not have home broadband services (43%) or a desktop or laptop computer (41%). And a majority of Americans with lower incomes are not tablet owners. By comparison, each of these technologies is nearly ubiquitous among adults in households earning $100,000 or more a year.
Americans with higher household incomes are also more likely to have multiple devices that enable them to go online. Roughly six-in-ten adults living in households earning $100,000 or more a year (63%) report having home broadband services, a smartphone, a desktop or laptop computer and a tablet, compared with 23% of those living in lower-income households.
Pew Research Center has studied Americans’ internet and technology adoption for decades. In continuing this research, the Center surveyed 1,502 U.S. adults from Jan. 25 to Feb. 8, 2021, by cellphone and landline phone. The survey was conducted by interviewers under the direction of Abt Associates and is weighted to be representative of the U.S. adult population by gender, race, ethnicity, education and other categories. Here are the questions, responses and methodology used for this analysis.
Conversely, 13% of adults with household incomes below $30,000 a year do not have access to any of these technologies at home, while only 1% of adults from households making $100,000 or more a year report a similar lack of access.
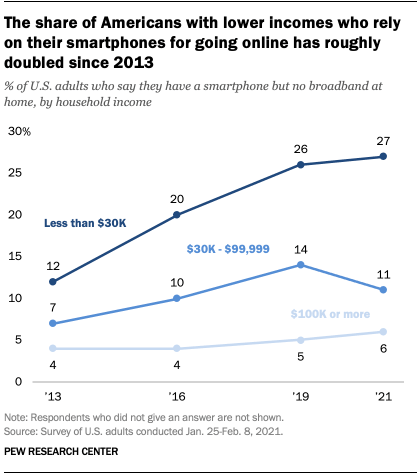
With fewer options for online access at their disposal, Americans with lower incomes are relying more on smartphones. As of early 2021, 27% of adults living in households earning less than $30,000 a year are smartphone-only internet users – meaning they own a smartphone but do not have broadband internet at home. This represents a substantial increase from 12% in 2013. In contrast, only 6% of those living in households earning $100,000 or more fall into this category in 2021. These shares are statistically unchanged since 2019, when the Center last polled on this topic.
This reliance on smartphones also means that the less affluent are more likely to use them for tasks traditionally reserved for larger screens. For example, smartphone owners with lower incomes were especially likely to use their mobile device when seeking out and applying for jobs, according to a 2015 Pew Research Center report.
The disparity in online access is also apparent in what has been called the “homework gap” – the gap between school-age children who have access to high-speed internet at home and those who don’t. In 2015, 35% of lower-income households with school-age children did not have a broadband internet connection at home, according to a Pew Research Center analysis of U.S. Census Bureau data.
The digital divide has been a central topic in tech circles for decades, with researchers, advocates and policymakers examining this issue. However, this topic has gained special attention during the coronavirus outbreak as much of daily life (such as work and school) moved online, leaving families with lower incomes more likely to face obstacles in navigating this increasing digital environment. For example, in April 2020, 59% of parents with lower incomes who had children in schools that were remote due to the pandemic said their children would likely face at least one of three digital obstacles to their schooling, such as a lack of reliable internet at home, no computer at home, or needing to use a smartphone to complete schoolwork.
Note: Here are the questions, responses and methodology used for this analysis. This is an update of a post originally published March 22, 2017, and later updated on May 7, 2019 by Monica Anderson and Madhumitha Kumar.

