The number of Hispanic eligible voters has grown at one of the fastest clips of any group over the past eight years and is projected to be 40% higher in 2016 than in 2008, according to a new Pew Research Center analysis of government data. U.S.-citizen Hispanics who turn 18 are the primary source of new eligible voters as some 803,000 young U.S.-citizen Hispanics enter adulthood each year and become eligible to vote. This chapter explores the demographics and geography of Hispanic eligible voters, among other topics.
How Many Hispanic Eligible Voters in 2016?

The Hispanic electorate is projected to reach 27.3 million eligible voters in 2016, up from 19.5 million in 2008. Most of this growth has come from U.S.-citizen Hispanics entering adulthood. Between 2008 and 2016, a projected 6 million U.S.-citizen Hispanics will have turned 18, becoming eligible voters.
There have been other, smaller sources of growth. The first is immigrant Latinos who obtain U.S. citizenship. From 2008 to 2016, some 2.2 million foreign-born Latinos are projected to have naturalized, becoming U.S. citizens and thus eligible to vote, according to Pew Research Center projections.3 The second is a growing outmigration from Puerto Rico to the U.S. mainland. Between 2008 and 2016, a net increase of 227,000 Puerto Rican adults moved to the U.S. mainland, becoming eligible to vote in U.S. presidential elections.4 Florida has been the single largest destination state for most Puerto Rican migrants in recent years (Krogstad, 2015c). As a result, Puerto Rican migrants in Florida could have a large impact on Florida’s Latino vote (Krogstad, Lopez and López, 2015).
Growing Number of Latino Nonvoters

As the number of Latino eligible voters has reached new highs with each election, so has the number of Latino voters. In 2008, a then-record 9.7 million Latinos voted, rising to 11.2 million in 2012. But one other statistic has also consistently reached new highs—the number of Latinos who do not vote. In 2008, a then-record 9.8 million Latino eligible voters did not vote. That number rose to 12.1 million in 2012, despite record turnout of Latino voters.
As a result, the Hispanic voter turnout rate declined from 49.9% in 2008 to 48% in 2012, reflecting slower growth in the number of Hispanic voters compared with the number of Hispanic eligible voters. The Hispanic voter turnout rate has also long remained lower than that among blacks or whites.
Changes in the Hispanic Electorate Since 2000
Educational Attainment on the Rise

The Latino electorate has seen gains in both the share with some college education and those with at least a bachelor’s degree. As a result, Latino eligible voters will have higher levels of education in 2016 than in any recent presidential election year. Hispanic eligible voters ages 18 and older will be twice as likely to have at least some college education (48%)—30% with some college and 18% with a bachelor’s degree or more—as to have not completed high school (20%).
By comparison, in 2000 about equal shares of Latino eligible voters had completed at least some college and not finished high school: 36% had attended college—24% with some college experience and 11% with a bachelor’s degree, while 32% did not finish high school.
As the share of Hispanic eligible voters with at least some college experience has increased, the share with less than a high school education has declined sharply, from 32% in 2000 to a projected 20% in 2016. At the same time, the share of Hispanic eligible voters who are high school graduates has remained at about 32%. These changes reflect broader educational trends among all Hispanics as a greater number and share of young Hispanics attend college (Krogstad, 2015a).
White and Asian eligible voters have higher levels of educational attainment than Hispanics, while blacks have similar levels. In 2016, 63% of white eligible voters will have attended at least some college, compared with 73% of Asian eligible voters and 53% of black eligible voters.
The level of educational attainment among these groups has risen among eligible voters since 2000. The share of white eligible voters with a bachelor’s degree has increased from 26% in 2000 to 34% in 2016. Among black eligible voters, this share has increased from 15% in 2000 to a projected 21% in 2016. The share among Asian eligible voters has risen from 40% in 2000 to 50% in 2016.
Meanwhile, the share of eligible voters with less than a high school education among these groups has been declining. Some 8% of white eligible voters and 13% of black eligible voters in 2016 will have less than a high school education. These shares have declined significantly since 2000, when 12% of white eligible voters and 21% of black eligible voters did not have a high school diploma. Among Asians, about one-in-ten eligible voters since 2000 have had less than a high school education.
Immigrant Generations and Hispanic Eligible Voters
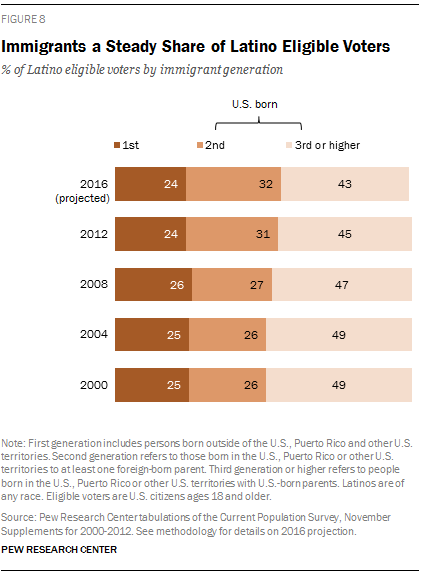
The fastest-growing immigrant generation among Latino eligible voters are second-generation Latinos; that is, those born in the U.S. to at least one immigrant parent. In 2016, second-generation Latinos will make up about one-third (32%) of Latino eligible voters, up from 27% in 2008 and 26% in 2000.

At the same time, the share of Latino eligible voters who are immigrants5 has remained flat since 2000, making up about one-in-four Latino eligible voters then and heading into 2016. 6But as the number of Latino eligible voters has grown, so too has the number who are immigrants. Between 2008 and 2016 (projected), about 2.2 million Latino immigrants will have become U.S. citizens and thus eligible to vote.
This stable share of the foreign born among Latino eligible voters contrasts with that seen among the nation’s Latino population overall. Since 2000 (Krogstad and Lopez, 2014a), the immigrant share among Latinos has declined from 40% then to 35% in 2013 as U.S. births have overtaken new immigrant arrivals as the main driver of Latino population growth (López and Patten, 2015).
The Hispanic Electorate Is Growing More Geographically Dispersed

The Hispanic eligible voter population is dispersing beyond California and Texas, the two biggest states by Hispanic population. California and Texas will have 12.2 million Hispanic eligible voters in 2016, or 45% of the nation’s total, the lowest share on record since at least 1988.
The decline is due to Texas. Texan Hispanics will make up a projected 19% of U.S. Hispanic eligible voters in 2016, down from 23% in 2008 and 24% in 2000. By contrast, California’s share has increased slightly during this time and is projected to be 27% in 2016.
The shrinking share of Hispanic eligible voters in Texas has come even as the state’s Hispanic population has grown by 49% since 2000. There were 6.8 million Hispanics in Texas in 2000, 3.2 million of whom were eligible voters. In 2015, there were 10.2 million Hispanics in Texas, with a projected 5 million Hispanic eligible voters expected for the 2016 election. Compared with Texas, California’s Hispanic eligible voter population increased twice as fast as even though its Hispanic population grew more slowly.
The declining Texan share among Hispanic eligible voters may be due to the state’s large and fast-growing Hispanic adult non-citizen immigrant population, a group that is ineligible to vote. Texas had 1.9 million non-citizen Hispanic adults in 2015, an increase of 51% since 2000. By comparison, California’s non-citizen Hispanic adult population increased as well during this time, but by just 2%. As a result, in 2015 non-citizens made up 28% of Hispanic adults in Texas, a share that has held relatively steady since 2000. In California, by contrast, the share of non-citizens among Hispanic adults declined from 46% in 2000 to 31% in 2015.
In both states, the number of Hispanic eligible voters has risen from similar bases, though California has outpaced Texas. From 2000 to 2016, California’s Hispanic electorate will have increased from 3.5 million to a projected 7.2 million, up 106%. For Texas, the number of Hispanic eligible voters will have increased from 3.2 million to a projected 5 million, up 57%.
In addition to California and Texas, there are four states where Hispanics will make up at least 15% of eligible voters in 2016: Florida, Arizona, New Mexico and Nevada.
In three of these four states, the Hispanic population has grown rapidly. In Nevada, the number of Hispanic eligible voters has increased from 228,000 in 2008 to a projected 388,000 in 2016, the highest percentage increase—70%—among the six states where Hispanics make up at least 15% of eligible voters. Meanwhile, in Florida the number of Hispanic eligible voters has increased from 2 million in 2008 to a projected 2.8 million in 2016. Arizona has also experienced fast growth in its Hispanic electorate, with a projected 1.3 million Hispanic eligible voters in 2016, up from 796,000 in 2008. Of the six states where Hispanics make up at least 15% of the population, New Mexico is the only one where the number of Hispanic eligible voters is down, from 539,000 in 2008 to 513,000 in 2016.
Hispanic Eligible Voters and 2016 Tossup States

Latinos make up about 15% or more of the electorate in three states where the 2016 presidential election is expected to be competitive—Florida, Nevada and Colorado. But in many states where Senate, governor or presidential races could be close in 2016, Latinos make up less than 5% of eligible voters.
2016 Presidential Election: Likely Tossup States
Though the 2016 Republican and Democratic presidential nominees are yet to be selected, the Cook Political Report projects that nine states—Colorado, Florida, Iowa, Nevada, New Hampshire, Ohio, Pennsylvania, Virginia and Wisconsin—that represent 115 out of a total 538 electoral votes could be tossups.
Latinos make up more than one-in-ten eligible voters in three of these key states—Florida (18.1%), Nevada (17.2%) and Colorado (14.5%). In each of these states, Latinos also represent a larger share of the electorate than the national Latino eligible voter share of 11.3%.
But in the six remaining tossup states, Latinos comprise 5% or less of the total eligible voter population. For example, in New Hampshire only 2.1% of eligible voters are Latino.
2016 Senate Elections: Likely Tossup States

There are five Senate races that the Cook Political Report has identified as likely to have close races—Florida, Illinois, Nevada, New Hampshire and Wisconsin. In four of these states, the incumbent is a Republican.
Latinos make up at least one-in-ten eligible voters in three of these five races. Some 18.1% of eligible voters in Florida are Latinos, as well as 17.2% in Nevada and 10.5% in Illinois.
In the remaining two states Latinos comprise less than 5% of eligible voters. Just 3.6% of the electorate in Wisconsin and 2.1% of the electorate in New Hampshire is Latino.
2016 Gubernatorial Elections: Likely Tossup States

When it comes to the 12 gubernatorial races that will take place in the fall, just four—Missouri, New Hampshire, North Carolina and West Virginia—have been identified as tossups.
Each of these states has low shares of Latinos among their electorate. In West Virginia, Latinos make up 1% of all eligible voters. Latinos comprise just 2% of eligible voters in Missouri and New Hampshire, and they make up 3% of the electorate in North Carolina.


