Home Broadband Adoption 2007
Summary of Findings
- 47% of all adult Americans have a broadband connection at home as of early 2007, a five percentage point increase from early 2006.
- Among individuals who use the internet at home, 70% have a broadband connection while 23% use dialup.
- Home broadband adoption in rural areas, now 31%, continues to lag high speed adoption in urban centers and suburbs. Internet usage in rural areas also trails the national average; 60% of rural adults use the internet from any location, compared with the national average of 71%.
- 40% of African Americans now have a broadband connection at home, a nine percentage point increase from early 2006. Since 2005, the percentage of African American adults with a home broadband connection has nearly tripled, from 14% in early 2005 to 40% in early 2007.
These findings come from a survey of 2,200 adult Americans conducted in February and March of 2007.
Broadband Adoption in 2007
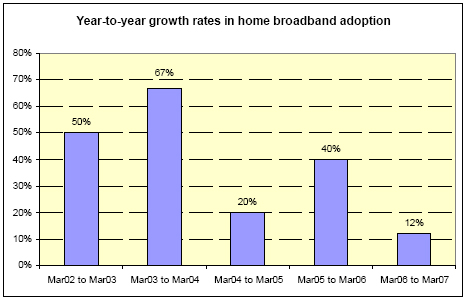
After exhibiting relatively strong growth between early 2005 and early 2006, home broadband adoption in 2006-2007 grew at its slowest rate in recent years. As of March 2007, 47% of adult Americans say they have a high-speed connection at home, up from 42% in early 2006. This 12% year-to-year growth rate is much lower than the 40% rate in the previous period.
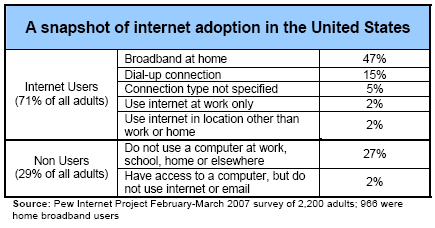
Currently, 71% of adults use the internet at least occasionally from any location; of these, 94% have an internet connection at home. Among adults with a home internet connection, 70% go online using a high-speed connection, versus 23% who use dialup.
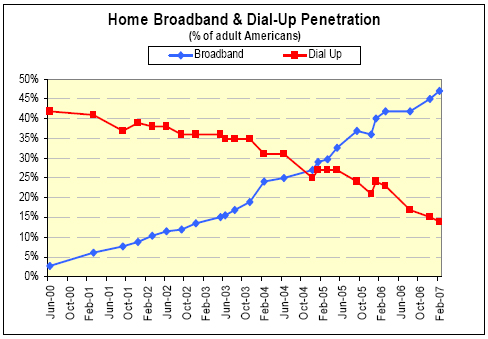
Despite relatively slow growth on a percentage basis compared with previous years, the number of home broadband users in early 2007 is now roughly as large (on a percentage basis) as the entire universe of internet users in the first year of the Pew Internet Project’s surveys of online use. In June 2000, 48% of respondents reported going online via any type of connection to check email or access the Internet, compared with the 47% who have a home broadband connection now.
Broadband Adoption Among Population Subgroups
Historically, high-speed internet adoption has been concentrated among the young, educated and relatively well-off. This trend held to form in our 2007 survey, as several historically broadband-heavy groups continue to have broadband usage adoption well above the overall average for adult Americans. In particular, broadband penetration remains high among Americans ages 18-49, those with annual household incomes over $75,000 and college graduates.
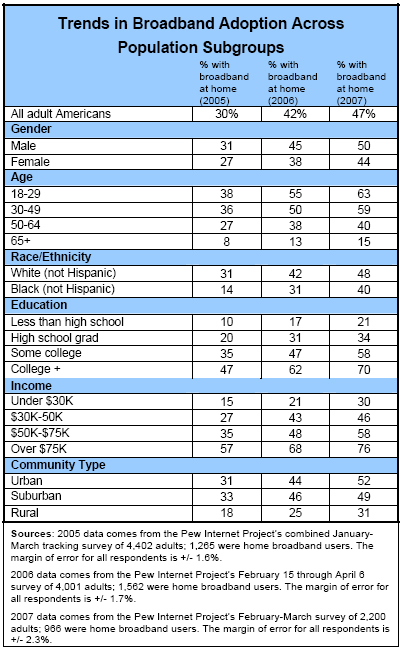
The 2005-2006 time period witnessed strong growth in broadband adoption across numerous demographic groups. As might be expected given the comparatively modest overall growth in broadband adoption for 2006-2007, growth rates among most population subgroups during the current time period were relatively modest by comparison. However, some demographic groups exhibited rapid broadband growth in 2006-2007 when compared with the adult population as a whole (year-to-year growth rates noted in parentheses):
- Those with annual household incomes under $30,000 (43%)
- African-Americans (29%)
- Residents of rural areas (24%)
- Those with less than a high school education (24%)
- Those who say they have attended some college, but have not graduated (23%)
Americans with annual household incomes under $30,000 are the only major demographic group for which broadband growth rates in 2006-07 (43%) met or exceeded those seen in 2005-06 (40%). Continued strong growth in broadband penetration among low-income households is particularly important both because of the size of this segment (25% of respondents in our February 2007 survey reported annual household incomes of under $30,000 per year) and because these lower income households have long been among the most under-represented groups in home high-speed adoption.
Several groups in particular exhibited low growth relative to the overall average. These include (year-to-year growth rates again noted in parentheses):
-
The age 50-64 cohort (5%)
-
Those with annual household incomes between $30,000 and $50,000 (7%)
-
Suburbanites (7%)
Focus on African-Americans
As recently as early 2005, broadband adoption among African-Americans was just 14%, among the lowest of any major demographic group. However, the past two to three years have brought rapid adoption of broadband by African-American adults. Today 40% of African-Americans have a broadband internet connection at home, an increase from 31% in March 2006.1 While this figure is lower than the home high-speed penetration rate for whites, it represents a 186% increase since early 2005. Put another way, African-Americans now “trail” whites by just one year with respect to broadband adoption—high speed internet penetration among African-Americans in 2007 is now roughly equivalent to that seen for whites in 2006.
The difference in broadband adoption between African-Americans and whites is due primarily to lower internet usage among African-Americans. Overall, 73% of whites use the internet at least occasionally from any location, compared with 62% of African-Americans. The relatively lower incomes and relatively lower average levels of educational attainment for African-Americans contribute greatly to this gap in internet usage, since individuals with low incomes and education levels (regardless of race) are generally much less likely to use the internet.2 When whites and blacks who use the internet at home are compared side by side, rates of broadband adoption are similar: 70% of African-Americans who use the internet at home have broadband compared with 69% of whites.3
Rural Broadband Adoption
Rural residents have long trailed their counterparts in the cities and suburbs in both internet usage and broadband adoption. As noted above, 31% of rural Americans have home broadband connections, compared with 49% of suburban residents and 52% of urban Americans. Rural broadband penetration still lags considerably behind the levels in non-rural America, but rural broadband continues to experience strong growth rates (albeit from a smaller base of users). Between 2006 and 2007, high-speed internet usage among rural adults grew by 24%, versus 18% for urban residents and just 7% for suburbanites. In the same way that African-Americans “trail” whites in broadband adoption by roughly one year, broadband penetration among rural residents in early 2007 is now roughly equal to broadband penetration among urban/suburban residents in early 2005.
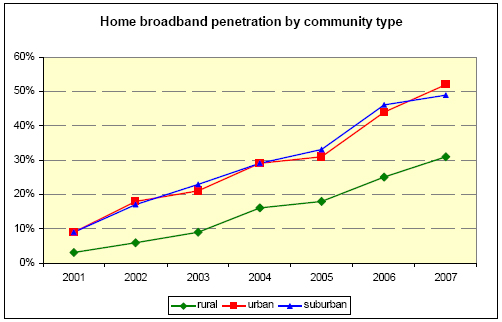
The gap in broadband penetration between rural and urban/suburban residents is comprised of two elements. As with African-Americans and whites, the first element is the low level of overall internet usage among rural residents—73% of urban and suburban residents use the internet at least occasionally, while 60% of rural adults are internet users.
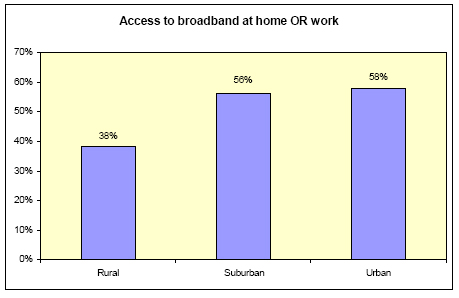
The second element of the rural broadband gap is the relatively low level of broadband adoption among rural residents who do use the internet. Just over half (55%) of rural internet users have a broadband connection at home; among urban/suburban adults, broadband adoption among internet users is 73%. Suburban and urban residents are also more likely to have access to a broadband connection at their place of employment; just over two thirds of rural adults (38%) have access to a broadband connection either at home or at work, versus more than 55% for urban and suburban residents.
Statistical analysis of the survey data controlling for factors such as income, education and age shows that both race and geography are significant factors in predicting overall internet usage. In predicting broadband adoption among internet users, however, the impact of race is negligible—African-Americans and whites with similar demographic characteristics show similar levels of broadband usage.
At the same time, the impact on broadband usage of living in a rural area is negative and significant. While our 2007 survey did not specifically ask respondents whether broadband was available in their area, previous studies have pointed to the lack of infrastructure in rural areas as a contributing factor in the slow growth in adoption of rural broadband, a theory that is consistent with the above findings.4
Latinos and Broadband
From June through October 2006, the Pew Internet Project and Pew Hispanic Center surveyed 6,016 Hispanic adults in order to gauge internet usage habits among Latinos.5 Respondents were allowed to complete this survey in either English or Spanish, thus painting a more comprehensive portrait of the Latino community than our traditional English-only tracking survey. As a result, this report uses findings from our 2006 Latinos survey in lieu of data collected from “English-only” Latinos in our February-March 2007 survey. Key findings relating to broadband usage among Latinos include:
- 56% of Latinos go online from any location. This is slightly lower than the rate of internet usage among African-Americans (62%) and rural adults (60%).
- 29% of Hispanic adults have a home broadband connection, compared with 31% for rural dwellers, 40% for African-Americans and 47% for the adult population as a whole. As with African-Americans and rural residents, low broadband penetration among Hispanics is influenced heavily by low internet usage within this group.
- Among Latinos with home internet access, 66% have a broadband connection; this is comparable to the overall percentage for all internet users (70%).
Broadband Adoption and Internet Usage Patterns
Previous Pew Internet Project research has highlighted the strong relationship between high-speed internet access and the richness and intensity of the online experience. Compared with individuals with a dialup internet connection, broadband users use the internet more regularly and engage more frequently in a variety of online activities.6
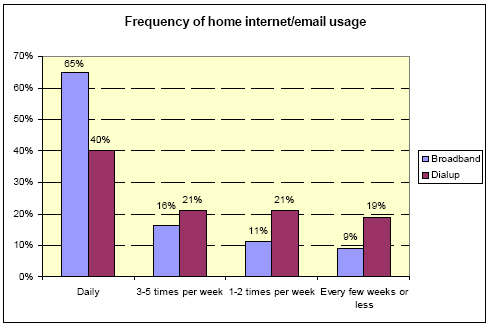
Our February-March 2007 survey shows this phenomenon proceeding apace. As the table below indicates, 65% of home broadband users go online from home at least once per day to use the internet or check email, compared with 40% for dialup users.
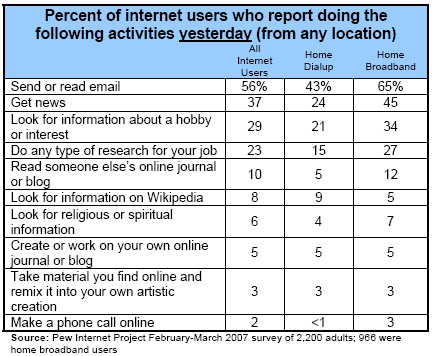
In addition to using the internet more frequently than individuals with dialup access, broadband users also participate in a wider range of online activities. It is perhaps not surprising that broadband users exhibit greater rates of participation in bandwidth-intensive activities, such as internet telephony, that are cumbersome and time consuming at dialup speeds. What is particularly notable is that broadband users are also more likely than dialup users to take part in several comparatively low tech (i.e. less bandwidth-intensive) online activities such as searching for information on Wikipedia or reading online news sites.
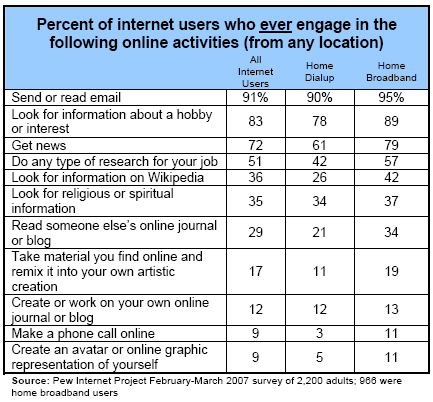
This broadband effect does not hold true across all of the online activities studied in our March 2007 survey. For instance, demographically similar broadband and dialup users exhibit little difference with respect to ever having looked up religious or spiritual information, or ever having worked on their own online journal or blog. For most activities, however, the presence of a home broadband connection is a key explanatory variable (controlling for demographic and socio-economic factors) in predicting whether a given individual has ever engaged in that activity.7 This analysis does not necessarily imply that broadband “causes” increased online engagement; those interested in doing certain activities may get broadband in order to pursue those interests. However, a high-speed, “always on” connection clearly allows users to engage frequently in a wider range of online activities than dialup users.
Because broadband users are more likely to go online on a daily basis than dialup users, this tendency among broadband users is particularly pronounced when looking at the activities broadband and dialup users engage in on a typical day.
