Overview: The people who use Twitter
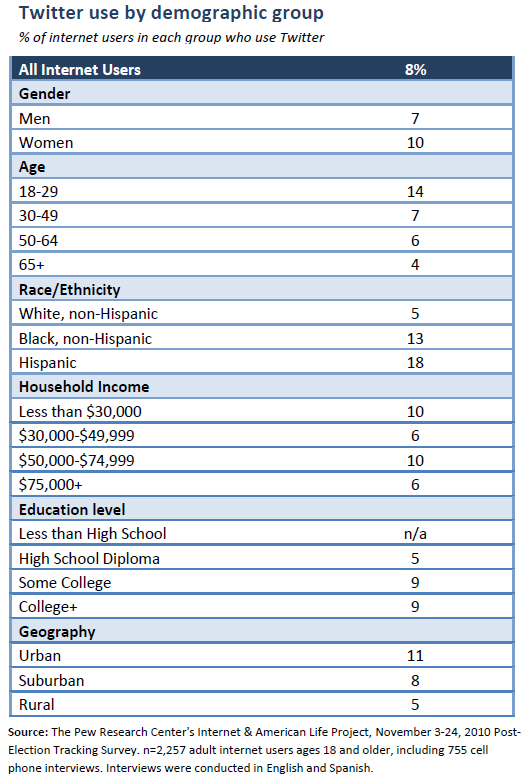
Eight percent of the American adults who use the internet are Twitter users. It is an online activity that is particularly popular with young adults, minorities, and those who live in cities.
This is the first-ever survey reading from the Pew Research Center’s Internet & American Life Project that exclusively examines Twitter users. In previous surveys, the Project had asked internet users whether they “used Twitter or another service to share updates about yourself or to see updates about others?”
Here is a little background on our reasoning for focusing just on Twitter in this more recent survey: The message service Twitter launched on July 15, 2006 and now claims tens of millions of users worldwide. It is one of the most popular online activities among tech enthusiasts and has become a widely used tool among analysts to study the conversations and interests of users, buzz about news, products or services, and announcements by commercial, non-profit, and government organizations. For instance, it is an important component of the analytical work by our colleagues at the Pew Research Center’s Project for Excellence in Journalism in its New Media Index, which assesses the most prominent topics discussed in social media every week.1
Since August 2008, the Pew Research Center’s Internet & American Life Project has been asking a question in occasional national telephone surveys about services like Twitter. In the 10-year lifespan of the Pew Internet Project, we have not usually asked about single, company-specific online applications or activities because our mission is to look generally at online activities, rather than at specific brands. For instance, when we looked at teens and gaming, we focused on genres of computer and online games, rather than usage of particular games.
In the case of Twitter, we initially framed the question in a way we hoped would capture Twitter users and others who use the same functionality on other kinds of internet services. Thus, our status update question in eight surveys between August 2008 and September 2010 asked: “Do you ever use the internet to use Twitter or another service to share updates about yourself or to see updates about others?”
In August 2008, 6% of internet users said “yes” to that question. In September 2010, 24% of internet users said “yes.” When we reported the findings at various points, much of the news coverage and public attention to those findings noted that the question – and the answers – covered more than just the Twitter-using population. But some analysts and readers clearly thought our figures simply stood for all Twitter users.
As we saw that impression taking hold, and as it was becoming clear that Twitter users were emerging as an important research subject on their own, we decided to use question language that exclusively focuses on Twitter. We added a straightforward question to our tracking survey that took place in November 2010 where we asked online adults: “Do you use Twitter?” In this survey, 8% of online adults said they do use Twitter—with 2% doing so on a typical day. This survey also showed that 74% of American adults are internet users, meaning that the Twitter cohort amounts to 6% of the entire adult population. The table below shows the basic demographic breakdown of that population.

Some of the groups who are notable for their relatively high levels of Twitter use include:
- Young adults – Internet users ages 18-29 are significantly more likely to use Twitter than older adults.
- African-Americans and Latinos – Minority internet users are more than twice as likely to use Twitter as are white internet users.
- Urbanites – Urban residents are roughly twice as likely to use Twitter as rural dwellers.
Women and the college-educated are also slightly more likely than average to use the service.
These findings about Twitter in Pew Internet’s regular tracking survey match the tests we ran on two omnibus surveys in October. Those omnibus surveys conducted by our polling partner, Princeton Survey Research Associates International, are weekly surveys onto which organizations can insert questions. In two differently weekly surveys in October, we also found that 8% of internet users said “yes” to the specific Twitter question.2
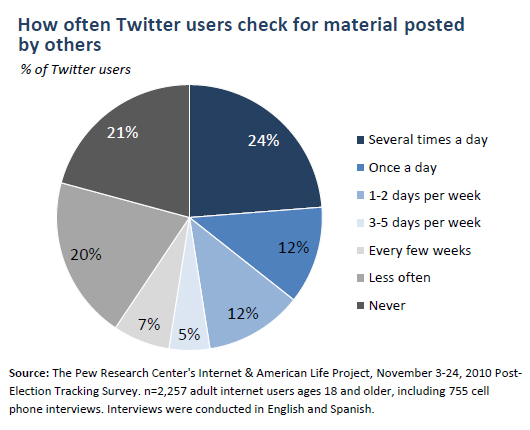
One-quarter of Twitter users check in multiple times per day for tweets from others, while one in five never check for new material on the site
In those omnibus surveys, we probed more deeply about how users engage with Twitter. There were 102 Twitter users in those surveys once we combined the datasets and the following material represents the findings from those Twitter users. We think that these findings provide a useful portrait of how Twitter users engage with the service. However, given the modest overall sample size these statistics are best understood as directional findings with a relatively large margin of error.
In the follow-up questions on those October surveys, we found that Twitter users are nearly equally divided between those who check the site on a daily basis (or multiple times per day) and those who check the site infrequently or never. Just over one-third of Twitter users (36%) check for material posted by others on a daily basis or multiple times per day—this is roughly comparable to the two in five (41%) who say they check the site less than every few weeks, or never do so at all. The remaining one-quarter of users say they check the site for updates a few days each week or every few weeks.

Twitter users post a wide range of content to the site
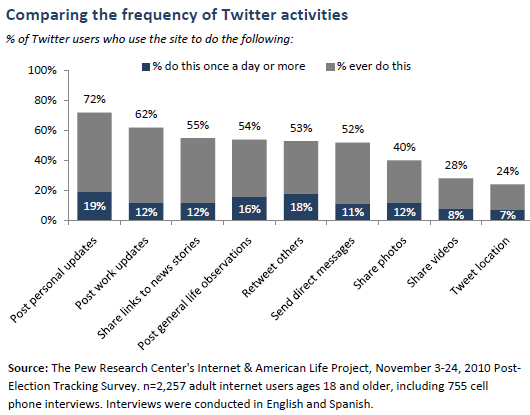
In addition to asking how often they check the site for updates about others, we also asked Twitter users how often (if ever) they use the site to post their own content. We asked about nine different types of content that Twitter users might post to the site, and found that Twitter users tend to comment on a relatively wide range of topics—the typical user posts four of the nine different types of tweets we asked about in our survey.
Overall, observations related to users’ personal or professional lives are the most popular types of updates, while location-based tweets and links to videos are the least commonly mentioned:
- 72% of Twitter users in our sample say that they post updates related to their personal life, activities or interests. A total of one in five Twitter users (19%) say they post personal updates once a day or more.
- 62% of those we queried said they post updates related to their work life, activities or interests, with 12% doing so on a daily basis.
- 55% of these Twitter users share links to news stories. One in ten (12%) do this at least once a day.
- 54% of these Twitter users say they post humorous or philosophical observations about life in general, with 16% doing so on a daily basis.
- 53% of these Twitter users use Twitter to retweet material posted by others, with 18% doing so on a daily basis.
- 52% of these Twitter users send direct messages to other users, with 11% doing so on a daily basis.
- 40% use Twitter to share photos with others, with 12% doing so at least once a day.
- 28% use Twitter to share videos with others. Fewer than one in ten Twitter users (8%) do this once a day or more.
- 24% use the service to tweet their location, with 7% of users doing so on a daily basis.


