Broadly speaking, perhaps the biggest problem with survey measurement of news consumption is that it seems to produce inflated estimates of how much news people consume when compared with other sources, such as ratings or online trackers.5 This may be because, on the whole, respondents feel social pressure to describe themselves as informed, which could cause them to consciously or subconsciously exaggerate their levels of news consumption – a phenomenon known as the “social desirability” effect. A previous Pew Research Center study has found that online surveys should reduce this effect, since respondents are not talking to an interviewer when giving their answers. Nevertheless, survey-takers may respond “aspirationally” by indicating how much they should have followed the news rather than how much they actually did. And it may be challenging for them to accurately remember just how often they got news from various platforms and providers.
At the same time, “passive data” – i.e., data collected without respondents having to report their own consumption in a survey – is not without its own complexities (see Chapter 3). Each news platform currently produces its own unique set of data (e.g., TV ratings, print circulation, web browsing metrics, social media impressions or podcast downloads) that are not directly comparable and would very likely rely on separate datasets with distinct groups of respondents, making comparisons far more difficult. Improved survey measures would thus have a distinct value in measuring news consumption, as they can measure usage of each of these platforms within a single population sample, and this chapter takes an exploratory approach to achieving that goal.
First, results from cognitive interviews shed light on how survey respondents understand the terms used in a standard news consumption questionnaire. For instance, when asked about cable TV news, can they provide examples or explain how it differs from national network or local TV news? These qualitative results help researchers to understand how respondents think through questions as they go about answering them and how they estimate their levels of news consumption.
Second, survey experiments test the effect of different approaches to measurement, such as question wording and item ordering. How can the findings about respondents’ awareness and understanding of the news media and their own news habits be applied to survey instruments in a way that aids respondent comprehension? What specific changes to question wording might produce more robust results?
The 21 cognitive interviews were conducted in late February and early March. The experiments were run in two separate surveys conducted April 17-19, 2020, (N=1,031) and April 24-25, 2020, (N=1,018) on Ipsos’ KnowledgePanel. Multiple experiments were conducted in each survey. For more detail, see the omni topline and survey topline.
In addition, throughout the planning stages of this research, a series of exploratory experiments was conducted using a nonprobability survey platform to examine the possible effects of different terminology, use of examples, sequencing of questions and the like. These experiments, while hardly definitive, were nevertheless suggestive of the potential consequences of different kinds of survey measures. This information, along with the cognitive interviews, led to the construction of the set of KnowledgePanel experiments described below. The results of some of these tests are discussed in the appendix.
Are the terms researchers use to ask about news consumption generally understandable among respondents?
People’s definition of news and news sources may differ; however, in order to do comparative research about how Americans consume news, it is important that respondents define and understand the different news platforms and providers similarly. (For more on what these terms mean, see the terminology at the top of the overview.) For instance, do people fully understand distinctions between more traditional forms of news consumption, such as cable, network or local TV, and newer digital platforms, such as social media, where such TV organizations might have a presence? Also, do these forms naturally come to mind when asked about news habits? And, finally, how do respondents “calculate” their news consumption – what process do they go through in thinking about how frequently they get news from different sources?
Results from the cognitive interviews shed some light on these questions. When asked by interviewers to talk through how they typically get news, participants reported a mix of television, online sources, radio, newspapers and magazines. Respondents also had little trouble understanding what was meant by TV, radio, print publications and digital devices such as smartphones and computers. (Note that nearly all of the participants reported “often” getting news from digital devices, suggesting that they may be somewhat heavier online news consumers than the population at large; indeed, this group should not be seen as nationally representative.) When probed, most participants limited their understanding of “print publications” to physical newspapers and magazines and did not include digital versions of these publications, which is consistent with what this item was intended to capture in the survey.
Social media stood out as a distinct form of news consumption, especially among participants who were 45 years and younger. One participant (woman, age 27) commented that, even though she considers news via social media to be “unreliable,” she is “already on social media for personal reasons, so it’s more convenient that way.” The same participant also said that “social media gives instant access that you can move on from quickly.” Another woman (21) offered, “I rarely use news websites or apps, only if I am specially searching out something. It’s not a normal thing for me to do. Social media is a big outlet for me to get the news.” Most participants who were ages 60 and older mentioned television, radio, newspapers and “online” when asked how they typically get news – but not “social media” specifically.
Understanding of major digital platform categories also was consistent among participants, for the most part. Participants generally understood “news websites and apps” to include things such as sites of cable news networks (such as CNN.com) and local television apps and sites, as opposed to social media sites. Participants also consistently understood “search” and search engines to be an individual-initiated action used to learn more about a story or to “cross-reference” information about a specific topic they may have heard about through other sources. For example, one participant (man, 35) commented that “Google is the main search engine I use. If I want to cross reference an article on, say CNN, I will go to Google and look up stuff about it.” Respondents also expressed general familiarity with email newsletters.
Do respondents naturally think of all platforms when they consider their news consumption?
For some of the sources of news and information mentioned in the cognitive interviews, however, respondents did not universally think of them as sources of news. For example, despite the strong sense of familiarity with newer digital platforms (such as streaming devices, smart speakers, or internet streaming services; see also Chapter 1), cognitive interview participants largely did not think of these as news sources without prompting.
In contrast, there was more frequent recognition of social media as a news source, though not all participants thought of it as an original or direct news source. For example, one participant (man, 35) said, “If I see an article on social media from CNN or Fox News, I would consider that as getting it from CNN or Fox News. Social media for me, especially Facebook, is like a news aggregator.”
Several participants omitted podcasts and search while initially discussing their news habits until these were explicitly brought up, particularly among people who do not use these platforms regularly for news. One respondent (woman, 27) who does not rely on podcasts or search for news said she “didn’t think about Google/search engines or podcasts” when asked about ways to get news digitally; “Really only social media.” Participants generally thought of podcast and search as digital gadgets that are possible ways to get news and information if one wanted to rather than as an original source of news or as being tied to a particular news organization, similar to the way respondents largely understood social media.
Similarly, though many said they got information from an advocacy group or an elected official or government agency, several participants volunteered that they did not think of these as news sources. Together, this suggests that broad questions asking about news use on general platforms may not capture all types of news consumption that researchers have in mind – particularly lesser-used platforms or sources that are less consistently understood by the public, such as these direct sources of news and information. At the same time, most participants who do not initially think of these platforms also do not use them for news – meaning that the impact on overall survey numbers may be minimal. Thus, researchers should take into consideration which types of news consumption they specifically wish to target; lesser-used platforms like podcasts or search need not be included unless they are of specific interest, and researchers must decide whether they will ask specifically about information directly from sources such as public figures and advocacy groups.
Are distinctions between traditional terms well understood by survey respondents?
For the most part, participants can differentiate between the different radio news providers that researchers ask about in surveys. Cognitive interview participants could accurately distinguish talk radio stations from public radio stations as well as identify types of stations like satellite and local radio.
However, the process revealed possible confusion with certain terms used for TV providers. Notably, participants could not easily tell the difference between national network TV and cable TV news organizations. And while participants generally were confident that they know what “local TV news” means, a few expressed confusion. Some said that national network TV was the same thing as cable TV, and several could not correctly identify news organizations that fall into the various buckets. Others outright said “I don’t know” or that they were confused; still others indicated that they are different but could not articulate those differences. This confusion could be mitigated by adding examples to survey items, the effect of which was tested in survey experiments detailed below.
Finally, how did participants ‘calculate’ their level of news consumption?
In the cognitive interviews, researchers asked follow-up questions and probes in order to gain a better understanding of how participants actually come up with their answers, especially with regard to the questions that ask about frequency of news consumption. Participants were asked what they were thinking of when they answered the platform battery: “How often do you get news from [platform]?” two ways: first, they were asked generally what they were thinking of while answering this question; then, they were asked what time period they had in mind.
By and large, two strategies emerged from the first probe. The first is that participants think of the different platforms they use to get news, with no specific programs or time frames in mind. For example, a participant (man, 66) said he was “thinking about devices and thinking about frequency generally.” One woman (28) said, “The devices that I use. I did not compare them to each other – just generally.” The other strategy is thinking about their news consumption habits within a specific time period, mainly throughout the course of a day. For example, an older man (63) said, “I listen to the radio every morning, I get news from my phone during the day, I watch cable TV news at night.” And a 45-year-old woman said, “I listen to the news in the morning on my smart speaker. I look at news on my phone during the day. I watch the news on TV at night.”
When asked specifically about the time period they were thinking of when answering how often they get news from various sources, many participants said they were thinking “generally” or that they had no specific period in mind. Several said they were thinking of their daily routine, two said they were averaging over the past couple of years, and some said they were thinking on a weekly or monthly basis. One participant (woman, 68) said, “Daily, weekly, monthly, in that order.”
The remainder of this chapter explores these themes further through survey experiments that test the impact of different question wordings and measurement approaches, including the addition of a reference period to questions about the frequency of news consumption and the use of examples.
Can examples improve respondents’ understanding of news providers?
In the past, news providers such as newspapers, network TV and radio were largely tied to a single platform (i.e., the physical medium through which the news is consumed). Daily newspapers published in print, network news appeared on TV sets and radio news traveled through the airwaves to a radio receiver. In a digital era, however, when news providers associated with various traditional platforms can produce content that appears online and arrives through a wide variety of digital devices, it may be harder to understand what it means to get news from a cable TV news organization. For instance, content produced by CNN may be consumed through a TV set, a website or a smartphone – and perhaps on Twitter or Facebook.
Even as news organizations now publish on analog (i.e., print, TV and radio) and digital platforms, their brand identities (and revenue streams) may still be associated with their legacy platform. In other words, local metro daily papers may publish online but may still be identified as newspapers and get most of their revenue from print; further, cable news channels have a large online presence but still identify themselves as cable news channels. As a result, collecting data on news consumption across provider types (e.g., daily newspapers, network TV, cable TV, public radio, etc.) in the same data structure still has value – and can illuminate important differences in the news people get from various types of sources.
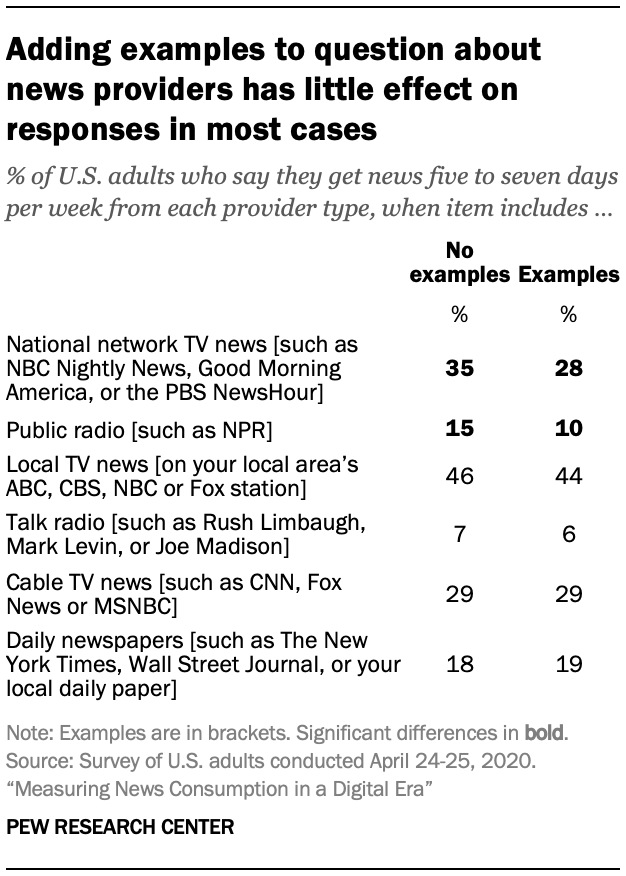
But if respondents are unsure where the boundaries are between different providers, how do researchers do this in a way that accurately measures which survey respondents use which different news providers? If respondents receive robust examples of each provider type, does this help? Survey respondents in these survey experiments were randomly assigned to one of two conditions, each of which showed a different version of a survey question. For example, about half the respondents were asked how often they got news from six provider types, such as “cable TV news” or “daily newspapers.” The other half of respondents were shown the same question but with examples provided for each item: “cable TV news (such as CNN, Fox News or MSNBC)” or “daily newspapers (such as The New York Times, Wall Street Journal, or your local daily paper).” Responses were then compared to detect any effects of these modifications to survey questions.
For the six provider types tested in the survey, four do not produce notably different estimates for frequent consumption (five to seven days per week) when examples are added. These include local TV news, cable TV news, daily newspapers and talk radio.
In the cases of national network TV and public radio, however, differing shares of Americans say they frequently get news from these sources depending on whether examples are added or not. For instance, 35% of Americans say they get news from “national network TV” at least five days per week, but when examples are added – “such as NBC Nightly News, Good Morning America, or the PBS NewsHour” – 28% say they do this. And 15% of U.S. adults say they get news from “public radio” five to seven days per week, but this figure falls to 10% when respondents are asked about “public radio, such as NPR.”
Does a specific response scale improve measurement of news consumption?
News consumption survey questions may use a relative response scale, asking how often respondents get news in each way: often, sometimes, rarely or never. This scale has some ambiguity given the varying frequency of publication or broadcast between providers and platforms (e.g., ongoing 24-hour cable TV news compared with once-daily print newspapers).
Alternately, researchers could ask respondents to provide a specific time measurement: How many days in the past week have they gotten news a certain way? Or did they get news that way yesterday?
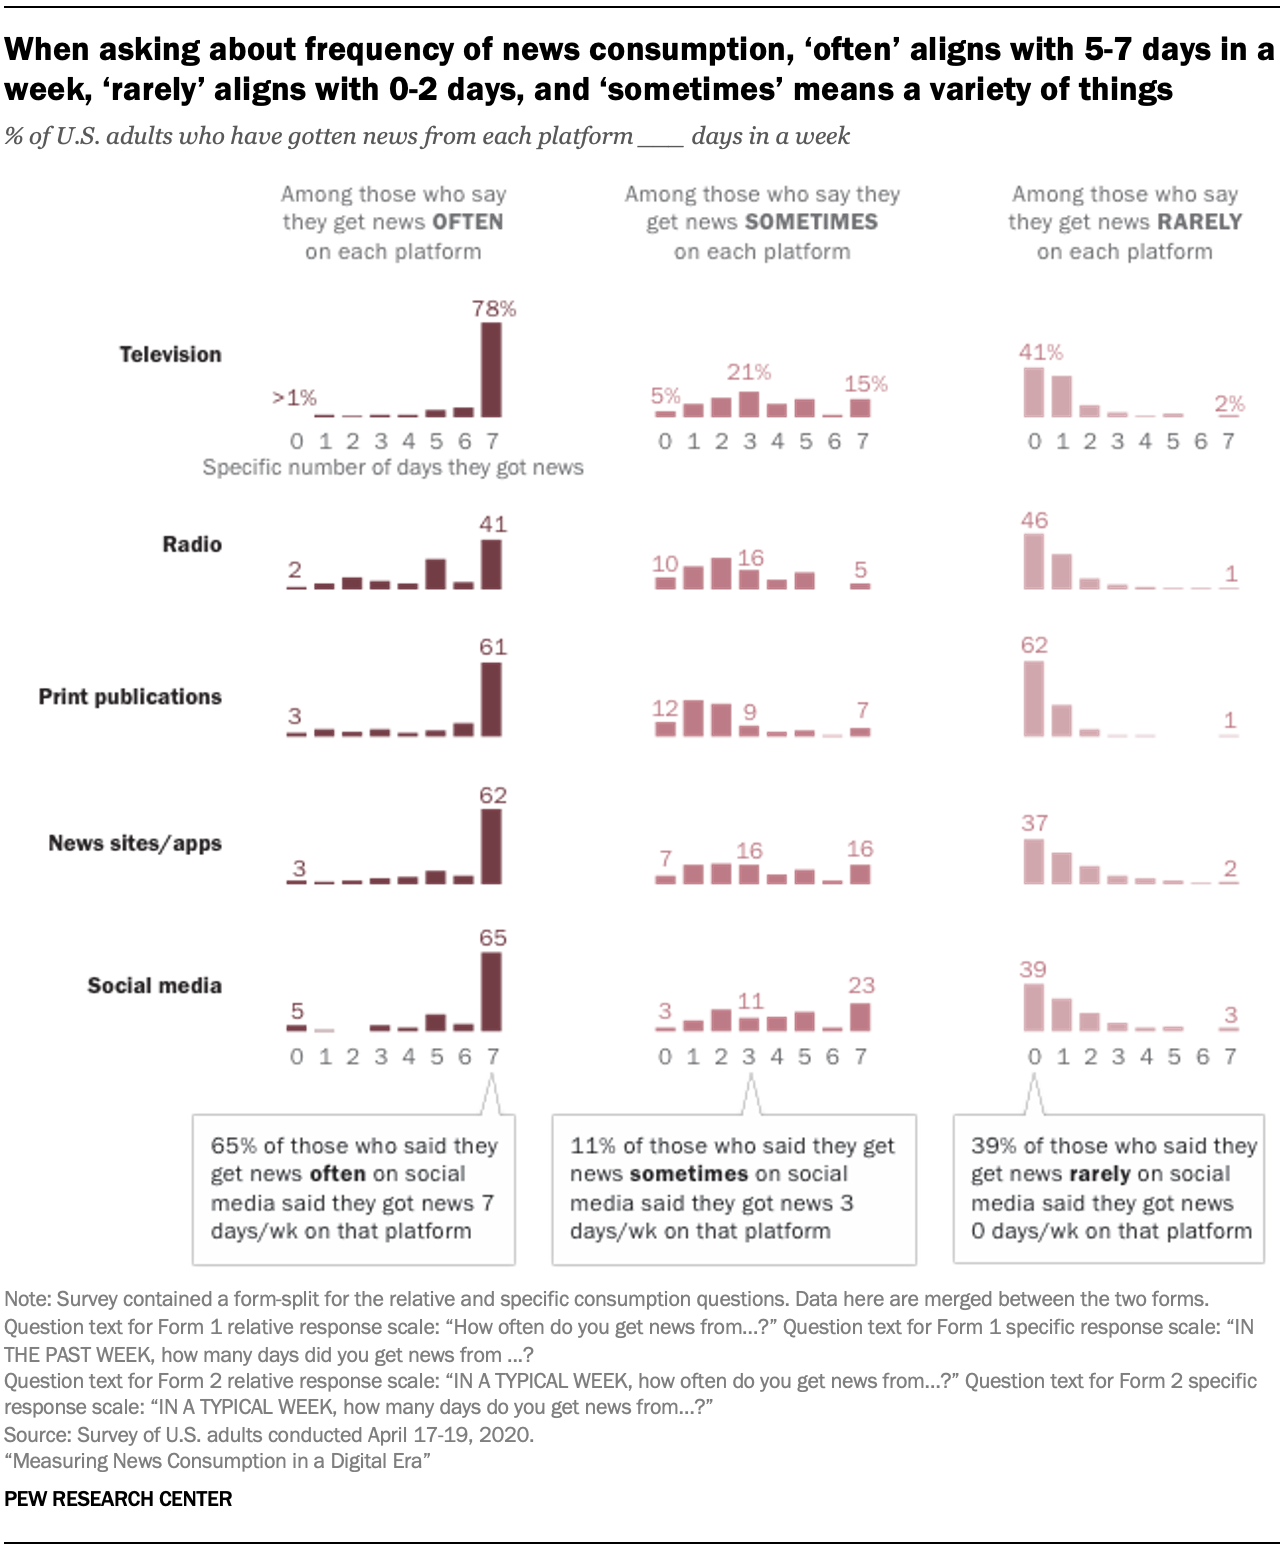
It is important to know what respondents mean when they say they get news often, sometimes or rarely; so, after using the relative scale to measure frequency of news consumption, the experiment included a follow-up question asking specifically how many days in a week respondents got news a given way.
The results (see detailed tables) show that those who say they get news from a given source “often” generally say they get news that way five to seven days per week. Americans who say they get news from a source “rarely” mostly seem to mean zero to two days per week. And those who say they get news from a source “sometimes” are more scattered – with most responses landing in the range of one to three days per week but with wider variation.
Does providing a reference period affect news consumption measurement?

Does providing a reference period – such as asking how often “in the past week” someone got news rather than how often in general – affect responses to news consumption measures? In theory, this could make it easier for respondents to reply accurately, since it is a more specific task, but it could also misrepresent their more general news consumption habits if there was something unusual about the period (e.g., a party convention happening in the past week or something atypical happening in the respondent’s own life). Alternatively, a middle ground may be to provide a more general reference period, such as “in a typical week.”
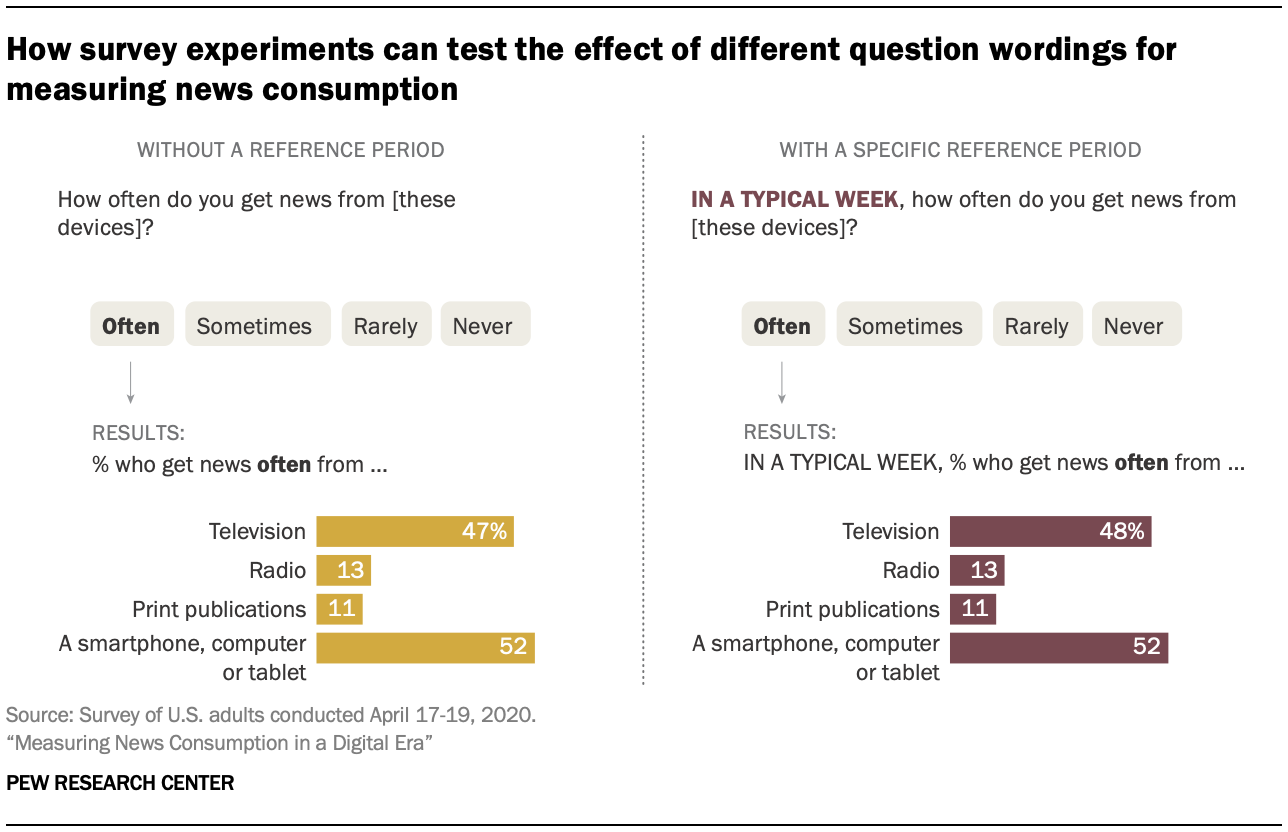
Pew Research Center tested three different approaches. The findings show that providing a general reference period has almost no effect on results. Those respondents who are asked about their use of various platforms “in a typical week” show the same incidence as those who are simply asked how often they use these different platforms, with no reference period provided. For example, 52% of Americans say they often get news from a smartphone, computer or tablet in general, which is identical to the share who say they do the same “in a typical week.”
The same pattern of little to no variance applies to a variety of more specific news sources, such as news websites or apps, social media, local TV and public radio. In all of these instances, and others, similar shares say they get news often from each source when they are asked about “a typical week” or without any reference period.
The one platform where there is a small but statistically significant difference is podcasts: 6% of Americans say they often get news from podcasts in general, while 3% say they do so “in a typical week.”
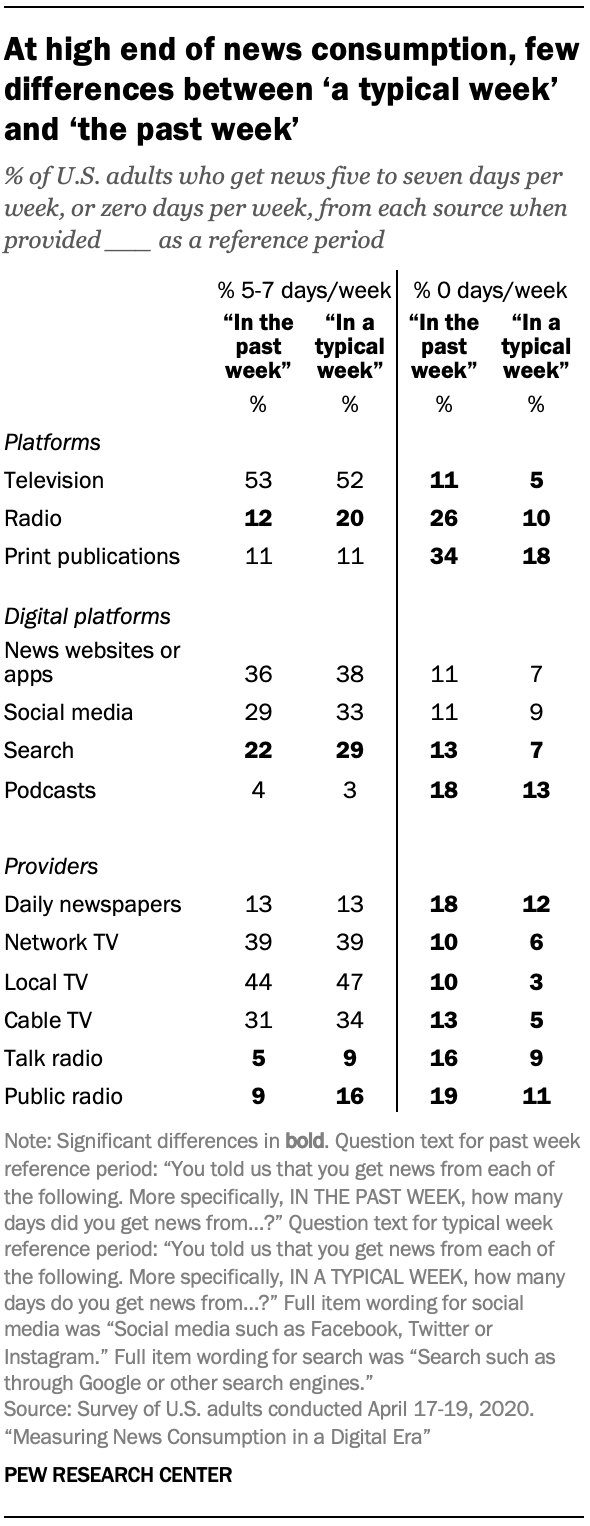
More differences emerge when respondents are asked about the number of days they get news in a specific reference period of “the past week” compared with “a typical week.”
Still, there is plenty of similarity in responses when it comes to the share of respondents who frequently get news a certain way. For instance, 53% of respondents say they got news from television five to seven days “in the past week,” which is nearly identical to the 52% who say they get news from TV as often “in a typical week.”
Respondents do, however, appear to be somewhat more likely to say they frequently get news from radio and search “in a typical week” than “in the past week.”
More consistent differences exist between these two reference periods at the other end of the spectrum – in the share who say they’ve gotten news a certain way zero days in a week. Respondents are consistently more willing to say they get news from radio, print publications and other sources at least one day “in a typical week” than “in the past week.” For example, 26% of respondents said they got news from radio zero days “in the past week” compared with just 10% who said this about “a typical week.”
Still, given the broad similarities in responses – and the fact that researchers are primarily interested in the portion of Americans who often or regularly get news a certain way, rather than those who “ever” (even if rarely) get news from a particular source – surveys can usually omit a specific reference period without affecting the quality of the data. One exception is if there is particular interest in radio or podcast consumption; in these cases, a specific reference period may be helpful. In any case, this provides additional evidence that respondents tend to calculate their news consumption aspirationally, given that the specific reference period of “past week” never resulted in higher estimates than the vaguer period of “a typical week” for the lowest end of news consumption.
Do respondents give different answers when the response scale is reversed?
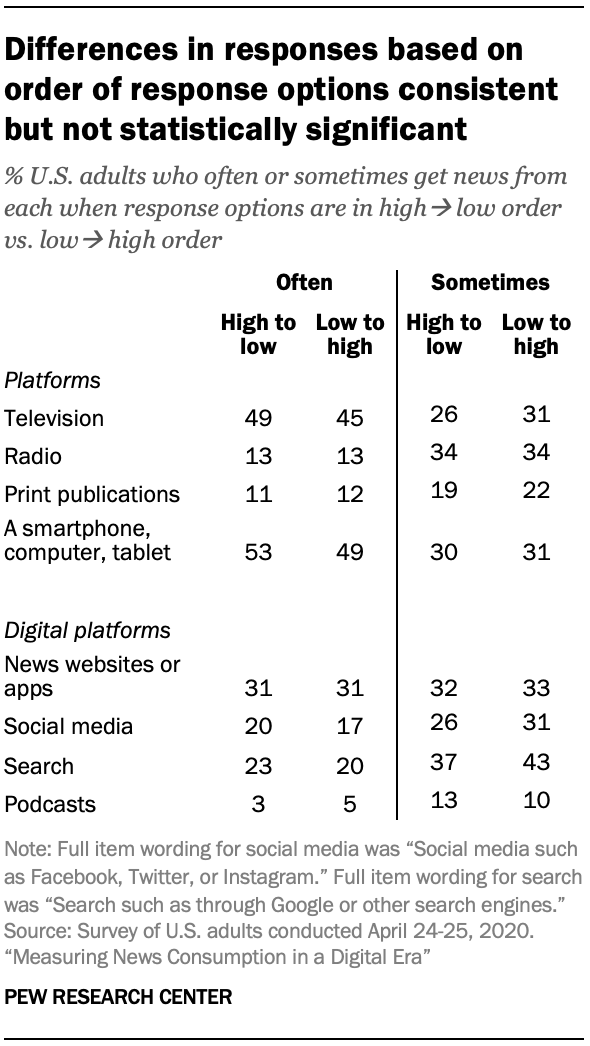
Surveys frequently order response options from high to low – e.g., starting with “often” and descending to “never” – to aid in respondent comprehension. However, research on ordering effects shows that respondents can disproportionately select the first response in a scale when taking an online survey like the ones featured in this study, which can lead to overreporting (also known as a “primacy effect”). As such, it may make sense to reverse the order and display the least frequent option (“never”) first and the most frequent option (“often”) last.
Although differences between the two conditions are not statistically significant, there is a clear pattern that the reverse-response scale produces slightly lower estimates of the portion who get news often from each source. Since there is no necessary reason why a scale needs to run in one direction or another, a response scale that runs low to high would be advisable if overreporting is a concern.


