By Courtney Kennedy, Kyley McGeeney and Scott Keeter
Now that over 90% of U.S. adults have cellphones,1 survey researchers are considering whether it is necessary to continue dialing landline numbers in random-digit-dial (RDD) telephone polls. A new Pew Research Center study finds that, for polls already conducting a substantial share of interviews with cellphones, the answer is generally “no” – at least if data quality is the only issue of concern.
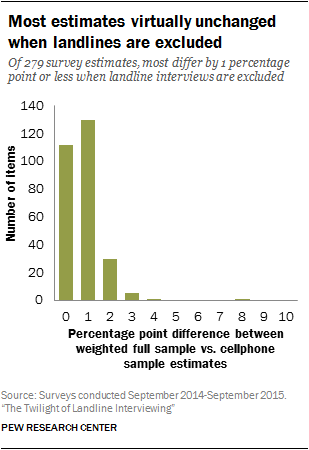
According to the study, poll results look nearly identical whether based only on those adults reached on cellphones or on a combination of cellphone and landline respondents. Analysis of more than 250 survey questions shows that when landlines are excluded, the estimates change by less than 1 percentage point, on average.
Contrary to concerns that polling is in some way broken, the study also shows that cellphone RDD samples are representative of the U.S. public on a number of key dimensions, particularly age, race and ethnicity. The amount of weighting needed to align the sample with demographic benchmarks is modest, with education and gender requiring the most adjustment.
Samples of adults reached via cellphone are much more demographically representative of the U.S. than samples of adults reached via landline. Consequently, replacing landline interviews with cellphone interviews reduces the degree to which survey data need to be weighted to be representative of U.S. adults. This in turn improves the precision of estimates by reducing the margin of sampling error. Perhaps not surprisingly, one major survey was recently redesigned to feature 100% cellphone interviewing.2
But while cellphone surveys can produce high-quality data that in some ways are superior to results of current dual-frame (landline plus cellphone) designs, neither Pew Research Center nor the telephone survey industry more generally is poised to immediately drop landline samples. Landline interviewing is roughly 30%-50% less expensive on a per-interview basis than cellphone interviewing. As a result, landlines remain an attractive option for achieving a fixed total sample size (e.g., n=1,000), even though the effective sample size after weighting is lower than would typically be achieved dialing only cellphones.3 There are also certain topics, such as experiences of elderly Americans and voter intention in low turnout elections,4 that landlines are still particularly useful for addressing.
In anticipation of this impending transition to 100% cellphone surveys, Pew Research Center has created an experimental weight that uses only interviews conducted with cellphones in nearly every survey since 2012. The weight simulates what the survey results would have been if only cellphones were dialed.
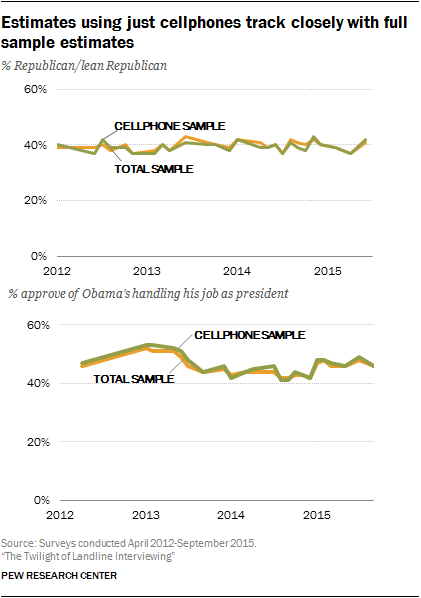
For key, commonly asked questions such as partisan affiliation, the difference between the published total sample estimates – based on landlines and cellphones – and estimates based just on the cellphone sample has tended to be quite small. For example, in April 2012, the share of U.S. adults identifying as Republican or leaning Republican was nearly identical when computed using the total sample (39%) versus just the cellphone sample (40%). The result was highly similar in a September 2015 survey (41% for total sample versus 42% for the cellphone sample).
The contours of trends also appear to be largely unaffected by dropping landlines. Both the total sample estimates and the cellphone sample estimates show President Obama’s job approval numbers increasing from the mid-40s to the low 50s in 2012, dipping in 2013-2014, and then rebounding slightly in 2015.
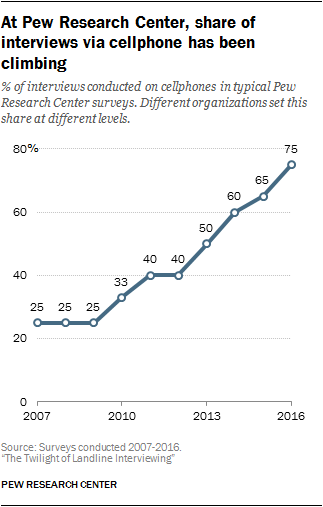
Pew Research Center has increased the share of interviews conducted on cellphones in typical surveys from 25% in 2007 to 75% in 2016 in response to the widespread adoption of cellphones. This means that any differences between cellphone sample estimates and total sample estimates should naturally narrow over time, as the former constitutes an increasingly large share of the latter.
This design change over time no doubt explains some of the similarity between the two types of estimates, particularly in recent years. It also means that, for surveys currently featuring a high proportion of interviewing via landline, conversion to 100% cellphone interviewing may not be seamless. The larger the current landline allocation, the greater the risk that estimates may change if the landline sample is abruptly excluded from the survey.
Testing the effect of dropping landlines on over 250 survey questions
While trends for a few key measures appear generally unaffected by the simulated exclusion of landlines, additional analysis is needed to determine whether this result holds for a broader set of survey questions. The effect from excluding landlines is fundamentally a question-level outcome. While it may be safe to exclude landlines when asking some questions, that may not be the case for other questions probing different topics.
To address this, we combined questions from eight different national dual-frame landline and cellphone RDD surveys conducted by Pew Research Center in the past two years into a large analysis. The measures range from attitudes about abortion, homosexuality and foreign policy to opinions about online dating, personal finances and views on the 2016 election. A complete listing is provided in the appendix.
For each of the 279 questions analyzed, we computed the difference between the weighted estimate based on the combined (cellphone plus landline) sample and the weighted estimate based on the cellphone sample alone.5 The average difference (absolute value) between these two estimates was less than 1 percentage point (0.78 points). The vast majority of questions (87%) showed either a 0 or 1-point difference.
Out of 279 questions, just one – “Do you have a cellphone, or not?” – showed a statistically significant difference. By definition, this estimate is 100% when just the cellphone sample is used. When landline interviews are included, the estimate is 92%. This finding is almost too intuitive to bother mentioning, as a survey that only dials cellphones would obviously be a nonsensical tool for measuring cellphone penetration. This result does, however, make the point that there are limits to what cellphone surveys can accurately measure.
It is also worth noting that while this analysis tested a large number of questions typical of those asked in public opinion surveys, it does not cover all possible survey domains. For example, questions about health, transportation or employment were not covered in the source surveys and therefore were not included in the analysis. As a result, researchers should be cautious if looking to generalize results from this study to other fields of inquiry.
Subgroup differences are largely confined to estimates for ages 65+
The fact that estimates for “all adults” generally are not affected by dropping landlines should provide some assurance to researchers facing this transition, but it does not address all concerns. Cellphone penetration rates are not uniform across all segments of the population. For segments where cellphone adoption is lagging (e.g., the elderly), discarding landline samples may have a more noticeable and problematic effect on survey estimates.
Examining the effect of excluding landlines on subgroup estimates is challenging because sample sizes for key subgroups are often relatively small and thus are subject to a fair amount of noise due to sampling error.
For example, a Pew Research Center political survey in September 2015 featured 1,502 total interviews, but the cellphone sample alone had 106 interviews with black non-Hispanics, 141 with Hispanics and 161 with adults ages 65 and over. These sample sizes do not provide strong statistical power to detect differences in total sample versus cellphone sample estimates.
Our solution was to perform the subgroup analysis using two very large national dual-frame RDD surveys. The 2014 political polarization and typology survey featured 10,013 interviews. The 2015 survey on government featured 6,004 interviews.
These studies have large enough subgroup sample sizes to support reliable tests of differences when simulating the exclusion of landlines. They also feature some overlap in questionnaire content. In order to assess the robustness of observed differences, we focused the analysis on questions asked in both of these large surveys. An exception to this is marital status, which is a common poll question but was only asked in the 2014 survey.
The analysis indicates that the effect on major subgroup estimates from dropping the landline sample tends to be small and is often inconsistent. For example, in the 2015 survey on government, the estimated share of Hispanics identifying as Republican or leaning Republican is 26% based on all the interviews versus 27% based on just the cellphone interviews. Similarly, on a 10-item index measuring ideological consistency, the estimated share of black non-Hispanics classified as consistently or mostly conservative is 8% based on all the interviews versus 7% based on just the cellphone interviews.
That aside, not all of the differences are minor. The estimated share of adults who are married is 44% based on the cellphone sample versus 48% based on the total sample. According to the 2014 American Community Survey (ACS), the actual marital rate among U.S. adults is 51%. This indicates that if marital status is not adjusted for in the weighting, married adults may be somewhat underrepresented in cellphone RDD surveys.
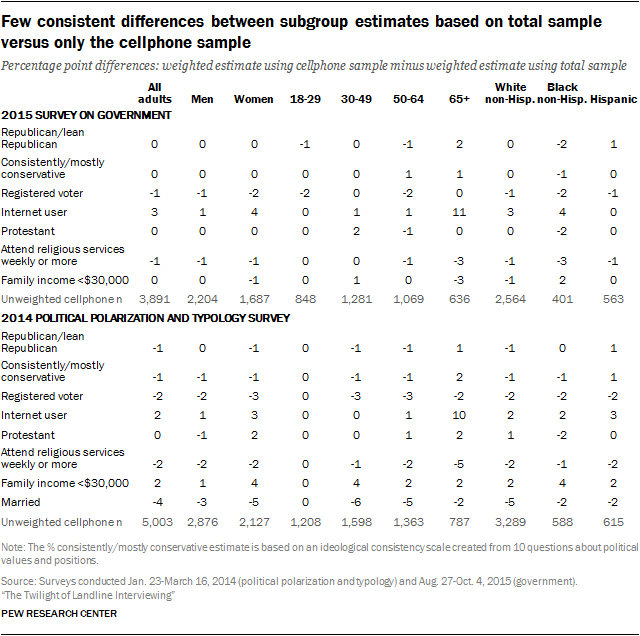
There is an even larger difference for estimates of internet usage among the elderly. When landline interviews are excluded, the estimated share of adults ages 65 and older who use the internet increases by at least 10 percentage points in both surveys. Dropping the landline interviews also reduces the estimated share of adults attending religious services weekly or more often. This is true for most of the major subgroups, but the change is most dramatic for those ages 65 and over.
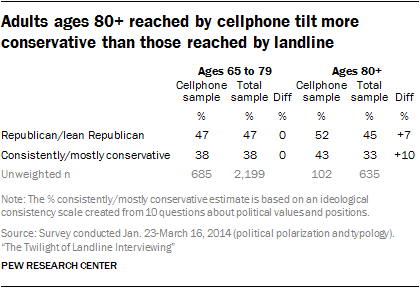
The data also suggest that political ideology estimates for adults ages 65 and older become slightly more conservative when interviewing is done only on cellphones. The estimated share of seniors identifying as Republican or leaning Republican and consistently or mostly conservative tick up by 1 to 2 percentage points in both surveys when landlines are not used. Deeper digging shows that this difference comes from the oldest members of that age group, in particular, those ages 80 and older.
In the 2014 political polarization and typology survey, when the landline interviews are excluded, the percent identifying as Republican or leaning Republican increases from 46% to 47% among the entire group of adults ages 65 and older. This reflects a 7-point increase among adults ages 80 and older and no change among adults ages 65 to 79 group. Similarly, on the political ideology index, excluding landlines triggers a 10-point increase in the share classified as consistenly or mostly conservative among those ages 80 and over but no change for those ages 65 to 79.
The mechanism(s) behind this pattern can be difficult to tease out since the number of cellphone interviews with adults ages 80 and older tends to be small, even in a very large RDD survey. Attempts to detect differences within an already small subgroup quickly run out of statistical power.
Still, analysis of 481 cellphone interviews with adults ages 80 and older from 20 Pew Research Center surveys conducted in 2014 and 2015 indicates that this effect is confined to men. Among this advanced age group, men reached by cellphone are more Republican than those reached by landline. There is no such difference among women.
In sum, while some groups commonly parsed out in public opinion surveys do not appear to be systematically affected by the transition to cellphone only surveys, this does not hold true for the very elderly. Future reseach should examine whether there are other commonly studied segments of the population whose estimates are sensitive to the exclusion of landlines in surveys.
As cellphone samples improve demographically, landline samples deteriorate
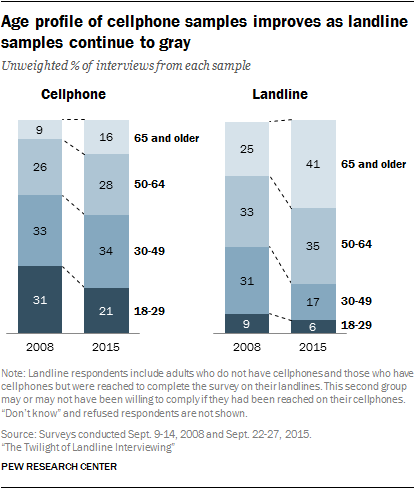
While cellphone samples have become more and more representative of the U.S. public, the trend with landline samples has been just the opposite.
In 2008, both cellphone and landline samples had lopsided age distributions, albeit in different directions. In a September 2008 Pew Research Center survey, the unweighted cellphone sample underrepresented older adults – 9% were ages 65 and older, compared with an ACS benchmark of 19% – and overrepresented young adults, as 31% were ages 18 to 29, compared with an ACS benchmark of 21%. At the same time, the landline sample was underrepresenting young adults (9%) while overrepresenting older adults (25%).
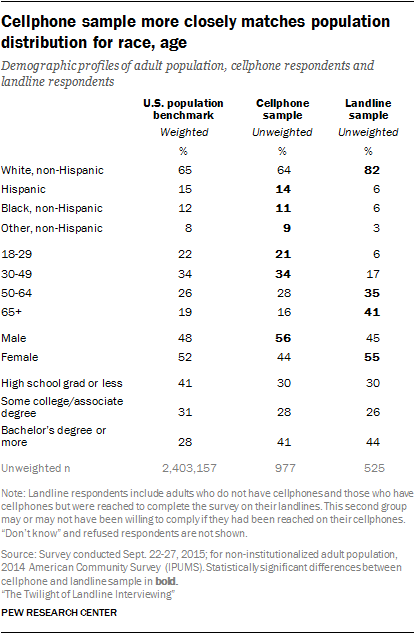
The story is quite different today, as cellphones are no longer the exclusive domain of the young. In a September 2015 survey, the unweighted age distribution of the cellphone sample was almost identical to ACS population benchmarks, including for those ages 65 and older (16% in the cellphone sample versus 19% in ACS).
Just as the improvement in cellphone samples has been rapid and dramatic, so has the deterioration of landline samples. From 2008 to 2015, the proportion of adults interviewed on landlines who are ages 50 or older has ballooned from 58% to 76%.
There are also stark difference between samples types on race and ethnicity. The important point here is not so much that cellphone samples are more representative in this respect than landlines – researchers have recognized this for several years – but rather that unweighted cellphone samples by themselves now look quite like the entire U.S. public.
In 2015, about one-in-ten cellphone respondents (11%) were black and about one-in-seven (14%) were Hispanic. These figures closely mirror the actual size of these groups in the U.S. adult population (12% and 15%, respectively). This indicates that a survey researcher could do a very good job representing these key subgroups using just a cellphone sample.
Landline samples, by contrast, skew heavily white non-Hispanic (82%) relative to the adult population (65%). As a result, many if not most RDD surveys that combine landlines and cellphones overrepresent whites on an unweighted basis and rely on weighting to correct for it.
Cellphone samples underrepresent women and adults with less education
While cellphone samples are quite representative on age and race/ethnicity, they do have their flaws. For one thing, they tend to skew male. The cellphone sample in the September 2015 survey was 56% male, 44% female, falling short of the ACS benchmark for women by 8 percentage points. This type of result is fairly common in contemporary cellphone RDD samples.
The mechanism behind this gender skew in cellphone samples is not well understood. For decades, landline samples have skewed female and continue to do so, but for presumably clear reasons. Women tend to live longer than men, and landline samples skew old. In addition, traditional gender roles may have contributed to women being somewhat more likely to answer the phone on behalf of the household.
For cellphones, there is no obvious narrative for the gender skew. One possible explanation is that men have lower levels of concern about privacy or telemarketing scams and are therefore more likely to answer calls from unfamiliar numbers, such as those from survey data collectors. Or perhaps men, on average, spend less time talking on their cellphones than women, making survey calls a slightly more novel experience for them. Hopefully future studies will move beyond speculation and shed some empirical light on the mechanism(s) behind this gender difference.
Education is a less mysterious but no less important challenge for both cellphone and landline samples. Both types of samples consistently underrepresent adults with lower levels of educational attainment, on an unweighted basis. Adults with a high school education or less constitute 41% of the public but less than a third of landline and cellphone sample respondents (30% for each sample type) in the September 2015 survey.
To address the gender and education disparities, as well as other demographic imbalances, Pew Research Center as well as other major survey organizations use weighting, in particular techniques such as raking, to align the survey sample to the population benchmarks.
Can dual users reached by cellphone represent those reached by landline?
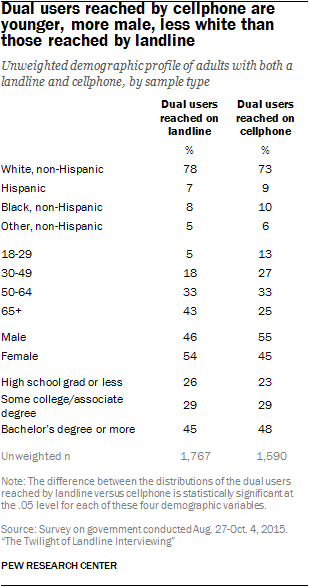
To understand why there is generally little effect on weighted estimates from dropping the landline sample, it helps to understand the overlap. In the context of dual-frame RDD, the overlap refers to the fact that some people have both landlines and cellphones, meaning they could be sampled on either. This means that there is partial duplication in population coverage provided by the landline and cellphone sampling frames.
In each Pew Research Center telephone survey, landline respondents are asked if they have a working cellphone and cellphone respondents are asked if they have a working landline. Respondents who report having both types of phone are known as dual users. In a typical survey the Center conducted in 2015, approximately 29% of all respondents were dual users reached in the landline sample. An additional 27% were dual users reached in the cellphone sample.
In thinking about excluding the landline sample in a future survey, it is worth considering how well the dual users reached by cellphone represent those reached by landline. At first blush, dual users from the cellphone sample look to be poor proxies for those reached by landline. Cellphone-sample dual users are significantly younger, more male, more educated and more racially diverse relalive to their landline-sample counterparts.
These groups also differ on key attitudinal and behavioral variables. For example, 37% of dual users from the cellphone sample report attending religious services weekly or more often, versus 44% among dual users reached by landline. Dual users from the cellphone sample are also less likely to consider themselves Republican or leaning to the Republican Party relative to their counterparts from the landline sample. On a bivariate basis – that is, just looking at responses from dual users by sample – the unweighted difference was statistically significant on each of seven key variables examined.
Upon closer examination, however, the differences on key attitudinal and behavioral outcomes are largely explained by the demographic differences between landline and cellphone respondents discussed above. Each of the seven outcomes was predicted using a regression model that controlled for age, sex, race/ethnicity and education. Depending on the nature of the variable, a linear, ordinal or binary logistic model was used. In each model, the outcome was estimated using only dual users and regressed on sample type (landline vs. cellphone), age, sex, race/ethnicity and education. If the effect of sample type, which was significant in each of the bivariate analyses, remained significant in the multivariate regression analysis, this would be evidence that dual users from the landline sample were distinct from those reached by cellphone – even after controlling for the known demographic differences.
As it turns out, for six of the seven outcomes, the effect associated with the sample type disappears (is no longer statistically significant) when controlling for the demographics. This means that the dual users reached by cellphone are reasonable proxies for those reached by landline, after accounting for differences across demographic variables that are adjusted for in the survey weighting.
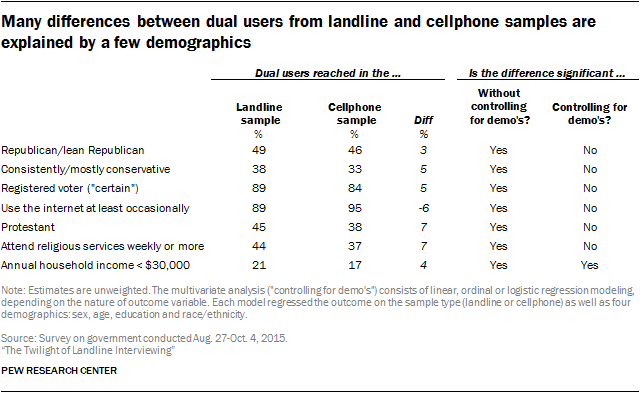
Household income is the one estimate in this analysis where the difference by sample type is not fully explained by demographics. Dual users reached by cellphone tend to have higher incomes than those reached by landline, even after controlling for sex, age, education and race/ethnicity. This result suggests that, for researchers using cellphone surveys to measure outcomes related to income, it may be worthwhile exploring the addition of income or some correlate thereof to the weighting protocol in order to reduce the risk of bias.
Surveys that only dial cellphones provide smaller margin of error
The effect on the precision of estimates (e.g. the margin of sampling error) is another important consideration in the transition to dialing only cellphones. Analysis of 27 national surveys of adults conducted by Pew Research Center between 2012 and 2015 shows that precision is consistently, though modestly, improved with a 100% cellphone design relative to a dual-frame landline and cellphone design, holding the total number of interviews fixed.
To investigate precision, researchers computed two approximate design effect6 values for each survey – one using the total sample weight and another using the experimental weight based only on the cellphone sample.
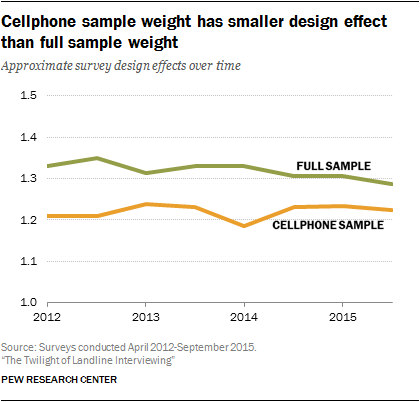
The approximate design effect is a useful metric for several reasons. It is a summary measure of how much weighting is needed to align the sample to demographic benchmarks for the target population. The more corrective weighting required, the larger the approximate design effect. In addition, the approximate design effect is well suited for comparison across different surveys because, unlike the margin of error, it is not a function of the number of interviews. The margin of error and the design effect are closely related, however. A design effect greater than 1 increases the width of the margin of error.
Between 2012 and 2015, the average approximate design effect of the experimental weight using just the cellphone sample was 1.22, which compares with an average of 1.32 using the actual survey weight based on both the landline and cellphone samples.
For a hypothetical survey with 1,000 interviews, the design effect difference translates into a margin of error at the 95% confidence level of plus or minus 3.4 percentage points using only cellphones versus plus or minus 3.6 points using both landlines and cellphone as allocated in the Pew Research Center surveys analyzed. In terms of statistical power, the cellphone-only survey would have roughly 60 more interviews than the dual-frame survey. In other words, cellphone-only designs tend to yield a larger effective sample size, all else being equal, than dual-frame designs.
The precision advantage of the design using only cellphones stems from three main factors. As discussed above, samples of adults reached by cellphone are much more demographically representative than samples of adults reached by landline, particularly with respect to age, race and ethnicity. This means that cellphone samples generally require less weighting correction than landline samples.
The other factors contributing to the precision advantage have to do with how survey weights are computed. When a survey has both a landline sample and a cellphone sample, the weight must include an adjustment to account for the fact that people with both landlines and cellphones could have been reached in both samples and, thus, have a higher chance of selection relative to adults with just one type of phone.7 This adjustment for the overlap in the sampling frames increases the variability in the weights and, in turn, the design effect. By contrast, surveys that only sample cellphone numbers do not need such an adjustment and avoid the penalty in precision.
Dropping the landline sample also arguably eliminates the need to include a weighting adjustment for respondent selection. Landlines are generally considered a household-level device. Typically, when interviewers dial landlines they select one adult to interview from among all the adults in the household. Researchers adjust for this by weighting up landline interviews proportional to the number of adults in the household.
Cellphone samples by and large do not feature this weighting adjustment because survey researchers tend to assume cellphones are a person-level device rather than a household-level device.8 The fact that cellphone surveys do not require as many weighting corrections as dual-frame surveys contributes to their greater overall precision.
Conclusions
To be sure, there is still more to learn about the implications of dropping landline samples, and evidence from other analyses point to some challenges. Cellphones continue to be more expensive on a per-interview basis than landlines, and the rate of cellphone use is not uniform across all segments of the public. In particular, cellphone use has a negative relationship with age.9 There is a compelling argument for retaining landline samples in surveys that focus on senior citizens or attempt to estimate technology penetration rates. In addition, there is evidence that dropping the landline sample would have a negative effect on data quality for surveys of likely voters in low-turnout elections,10 at least in the near term.
For public opinion surveys intended to represent all U.S. adults, however, we find that cellphone RDD samples are a strength rather than a weakness. Demographically, cellphone samples are much more representative of the public than landline samples and, in turn, require less weighting. Relative to Pew Research Center’s current design of fielding a majority of interviews with cellphones, moving to a 100% cellphone design would not meaningfully change most estimates.