While survey research in the United States is a year-round undertaking, the public’s focus on polling is never more intense than during the run-up to a presidential election. This essay is our attempt as survey methodologists and social science researchers to assess the state of the craft in 2019.
“Can I trust the polls?” is among the most common questions we get at Pew Research Center. And, maybe more to the point, “Which polls can I trust?”
There’s a reasonably straightforward answer to the first question. Rigorously conducted surveys are still trustworthy, as long as you apply a dose of discrimination and are realistic about what polls can and can’t do. But the answer to the second question – how to sort the “good” polls from the “bad” – is considerably trickier in this age of polling industry change and innovation.
Before we dive into how best to attempt that sorting, let’s take a broader look at the issue of trust in polls.
Is polling broken?
Here’s a myth that we can set aside right at the start: Polling is not “broken.” Well-designed and carefully administered surveys still work, and there’s plenty of empirical evidence to back this up.1
Even outside the U.S., there is substantial evidence that polling hasn’t witnessed a substantial decline in accuracy. A comprehensive review of polling accuracy published in 2018 found that “relying on vote intention polls from more than 200 elections in 32 countries over a period of more than 70 years, there is no evidence that poll errors have increased over time….”
Wait, what about those 2016 presidential election polls?
Try our email course on polling
Want to know more about polling? Take your knowledge to the next level with a short email mini-course from the Pew Research Center. Sign up now!
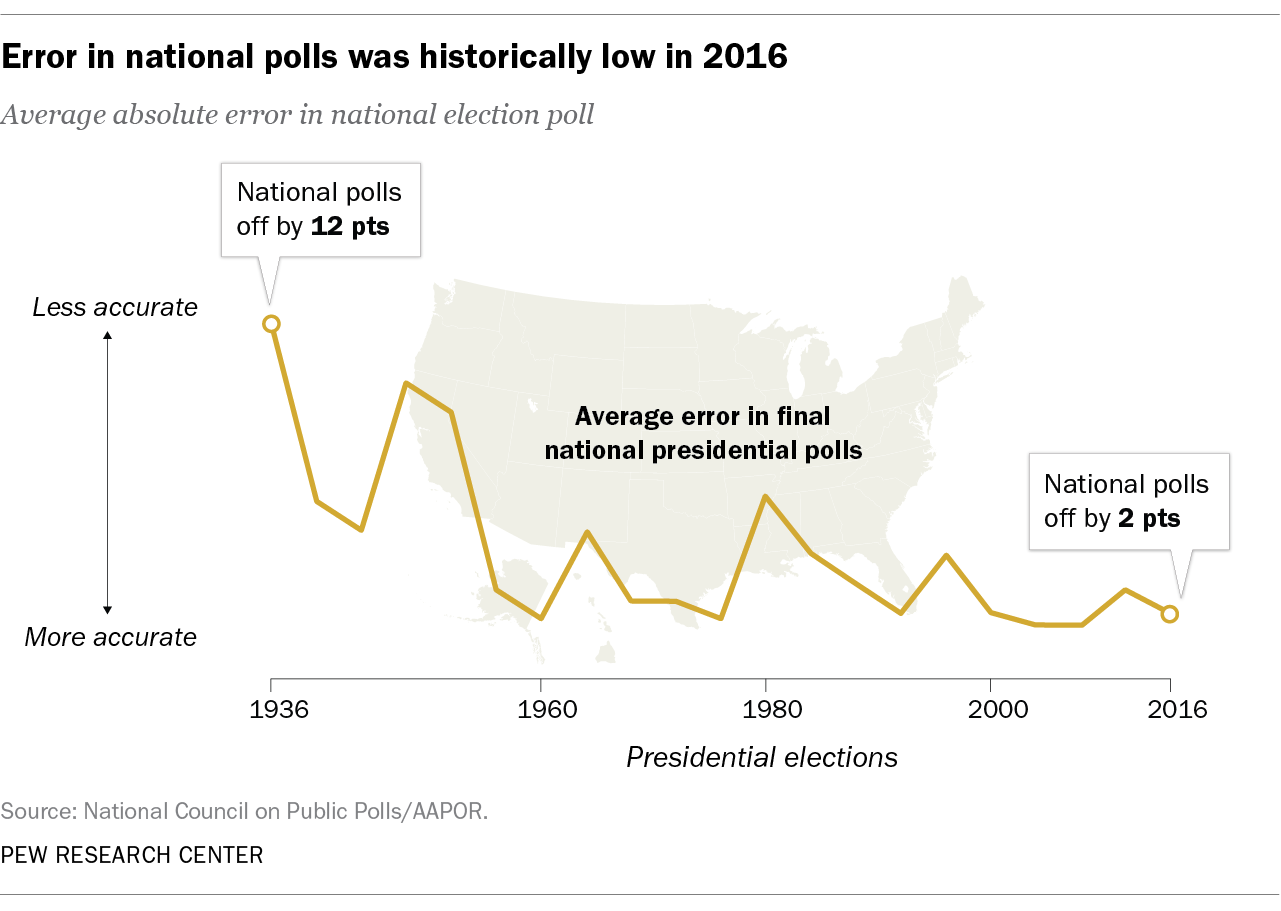
In 2016, problems with polls in a few key Midwestern states led many people to underestimate the chances of a Donald Trump victory. As a consequence, the immediate post-election assessment was that there had been a complete polling meltdown.
But that “insta-narrative” turned out to be oversimplified. The 2016 election was not, in fact, an industry-wide failure for the polls.2 Rigorous national surveys – designed to measure the popular vote rather than capture the effects of the Electoral College – were quite accurate by historical standards. An average of the final, publicly released national polls suggested that Hillary Clinton would win the overall popular vote by 3 percentage points, and she ultimately won by 2 points.
And while there were real misses among the state-level polls, a comprehensive post-mortem by the American Association for Public Opinion Research (AAPOR) found that most of the problems are amenable to fixing.
Front and center among these problems is the fact that many state pollsters didn’t adjust their 2016 polls to reflect that college graduates are more likely to take surveys than adults with less formal education. This mattered more than in previous years, when there weren’t big partisan differences between the two groups. In 2016, however, college grads broke for Clinton while high school grads broke for Trump. State polls that didn’t adjust – or weight – their data by education were left with a biased sample.
A second issue was some states that turned out to be key to Trump’s victory had few, if any, public polls in the field in the last few days before the election. All evidence suggests that more undecided voters swung to Trump than to Clinton in those last days, a trend most state polls were unable to detect as they had already stopped interviewing.
In the next big election cycle, the 2018 midterm, polls accurately measured the size of the Democratic wave nationally and did a little better than the historical average of polls in races for the U.S. Senate.3
A few high-profile errors were memorable, most notably in Florida where polls overestimated the Democratic candidates’ chances of winning the gubernatorial and U.S. Senate races. But both were decided by tiny margins. Meanwhile, polling errors in U.S. House races were as expected.
Looking ahead to 2020, election junkies can expect to see some high-quality polling done at the national level and in many states. But make no mistake: High-quality state-level polling in the U.S. remains sparse and underfunded. Somewhat alarmingly, a number of state pollsters continue to ignore the overrepresentation of college graduates (who happen to be Democratic-leaning) in their polls, running the risk of repeating the mistakes of 2016.
How has technological change affected polling?
The polling industry was founded using mail and face-to-face interviews before it adapted to the rise of telephone connectivity. It is in the midst of another metamorphosis, changing once again to meet the spread of internet access. This means we are in a period of great variety in survey methods. With that comes innovation, risk, creativity and challenges.
While evidence suggests that well-funded, telephone-based surveys still work, they have become much more difficult and expensive to conduct. Difficult because the swarm of robocalls Americans now receive, along with the development of call blocking technologies, means that lots of people don’t answer calls from unknown numbers. Response rates have gone from 36% in 1997 to 6% today.
We are in a period of great variety in survey methods. With that comes innovation, risk, creativity and challenges.
The good news is that Pew Research Center studies conducted in 1997, 2003, 2012 and 2016 found little relationship between response rates and survey accuracy, and other researchers have found similar results. The bad news is that it’s impossible to predict whether this remains true if response rates go down to 4%, 2% or 1%, and there is no sign that this trend is going to turn around as peoples’ technology habits continue to evolve.
Meanwhile, the costs for phone polls have curved sharply upward, largely driven by the challenge of getting respondents to talk on the phone. This limits the number of organizations able to underwrite a rigorous phone survey. And the expense of phone polls is particularly highlighted when compared with the low cost of the latest survey mode on the block.
If phone polls are fading in dominance, what is filling the void?
In short, the internet.
As digital access became the norm, pollsters began to look for a way to reach respondents online. This method has a number of upsides. People can take the survey in private and at their convenience, pollsters don’t have to hire and manage roomfuls of live interviewers or pay phone bills, and survey methodologists have found that there are measurement advantages to self-administration. Market research surveys moved en masse to the web, and academics were drawn to the combination of low costs and ease of experimentation.
There is, however, one significant challenge. While there are ways to draw random samples of the U.S. population offline using master lists of people’s home addresses or phone numbers (thanks to the U.S. Postal Service and Federal Communications Commission, respectively), there is not yet a way to do this through the internet.
For one, about 10% of Americans still remain offline, and that 10% is very different from the other 90%. But even for those online, there is no list or uniform way to find them. Even if every U.S. adult had one and only one email address (which is far from the case), a universal list of all these addresses from which to draw a sample doesn’t exist.
This matters because traditional survey research is aggressively based on the statistical theory of the random sample, where every member of the population has an identical (or at least known and nonzero) chance of being included. This produces surveys that reflect the country in all its racial, ethnic, religious and income diversity. Low response rates can erode the randomness of the sample, but there is evidence that starting the polling process with a true cross-section of the public helps accuracy.
The challenge of online polls (probability-based and opt-in)
The rise of the web as a survey research platform has driven a massive wave of innovation in survey design and sampling. This creative energy typically takes one of two broad approaches to the problem of how to derive representative samples from an unrepresentative pool.
One approach is to recruit survey participants from an inclusive and probability-based frame (such as by phone or mail) to participate in surveys online over time. Because this kind of recruitment can be expensive and time consuming, most researchers in this space are empaneling these survey participants, meaning they pool them into a representative group that can take multiple surveys on various topics over an extended period of time.
Often referred to as “probability-based online panels,” this approach combines the statistical properties that underlie survey sampling (for example, the ability to calculate a margin of error) with the advantages (efficiency, quality, convenience, format) of an online survey platform. Some of the most widely known probability-based online panels include the Ipsos KnowledgePanel, the NORC AmeriSpeak panel, the USC-Dornsife Understanding America Study and the RAND American Life Panel.
Pew Research Center’s American Trends Panel (ATP) is also a probability-based online panel. We select a random sample of the public and reach them via snail mail at their home addresses. Those selected are invited to complete surveys online, and those who do not have internet access are provided with tablets and data plans to facilitate their participation. (You can read about the details of this approach in our report on building the ATP here.) Increasingly, because of the challenges facing phone polling, we are moving our U.S.-based surveys over to this online probability panel.
Not all probability-based online panels are the same. Key variations include extra efforts to recruit and retain hard-to-reach populations (non-internet users and non-English speakers being two prominent groups), how often panelists are asked to participate in surveys, and the size and longevity of the panels themselves. Studies benchmarking survey results against known parameters suggest that this approach to online surveys generally delivers solid results, though these design issues do matter.4 Still, the startup costs of creating these panels and the slow turnaround time they require on each survey mean they are not the perfect fit for every purpose.
Another large segment of the online polling world has turned toward so-called “opt-in” surveys. This designation covers a wide range of products, from large databases of consumers to sophisticated quota samples that use statistical adjustments to better reflect the national population. In this work, respondents are not randomly selected but found wherever they can be found: recruited through ads on websites, memberships in customer loyalty programs, or just because they signed themselves up to join a survey panel. These kind of polls are sometimes called nonprobability surveys because they do not use a random or probability sampling design and so do not begin with a representative sample of the entire public. Some of the most commonly cited opt-in online surveys come from YouGov, SurveyMonkey, The Harris Poll, Morning Consult and Lucid.
The upside of opt-in surveys is generally cost. The laborious process of recruiting a random sample is replaced by volunteers scooped up from a wide range of sources. The downside is that these self-selected survey takers are not a natural cross section of the nation. Not only can opt-in surveys get a biased sample of the population, in today’s digital age they can also inadvertently include entries from outside the population they hope to study (such as from other countries, from children, even from bots). The challenge for opt-in pollsters then becomes one of both screening and rebalancing these samples to mirror a cross-section of the nation.
Do online opt-in polls work?
Do these online, opt-in surveys include enough different kinds of people in large enough numbers to enable them to represent America?5 The quick answer is that some of these polls are building decent track records based on careful statistical adjustments while others are not. This sector of polling is too varied to paint with the same brush.
Perhaps the biggest challenge is that most online opt-in surveys are commercial products, meaning their methods are proprietary and closed to public scrutiny. This makes it hard to evaluate and compare the methods different organizations use to select their samples and calibrate their results.
What is clear is that online opt-in polls are not equal when it comes to data quality.6 A Pew Research Center study suggests that online opt-in surveys range widely in accuracy. Overall, the opt-in surveys were off by about 6 to 10 percentage points compared with national benchmarks from rigorous federal surveys. But this error rate was substantially higher when looking at more difficult to survey subgroups, such as those under age 30 and Hispanic adults. Other research teams have documented that errors tend to be larger in opt-in polls. One takeaway is that even when opt-in survey researchers can rebalance their results to match the population at large, they still struggle to provide accurate representation of subgroups – a note of caution to survey readers who like to look beyond the “topline.”
How can you tell a ‘good’ poll from a ‘bad’ one?
The longevity of phone polls has allowed scholars time to study them and establish basic standards and best practices. For this reason, it’s a fairly straightforward task to sort more rigorous phone polls from the rest. In general, rigorous surveys are those that are paid for and fielded by a neutral source; have selected a probability-based, random sample of the public (or the population of interest, such as registered voters); dial cellphones in addition to landlines; make multiple attempts to reach people; use live interviewers; and make public both the questionnaire and a detailed methodology.
On the other hand, creating a quality checklist for online opt-in polls remains a challenge and a work in progress.7 Some considerations are the same as for phone polls, as they too should be funded and conducted by a neutral source and transparent with their questionnaires and methodologies. Beyond these basics, evaluating the quality of an opt-in election poll should consider the following questions: Does the sample include all kinds of Americans? Does it include them in roughly the right proportion compared to their share of the population? If not, how are researchers working on the back end to address these issues?8
The Center is now several years into a sustained effort to evaluate these surveys, and several key findings have emerged. Online opt-in polls are not monolithic – some vendors produce more accurate data than others. What separates the better vendors is that they adjust their surveys to be representative on a large set of variables that includes both demographics (e.g., race, age, sex and, per the lessons of 2016, education) and political variables (e.g. party affiliation, voter registration status). Less accurate vendors tend to either not weight their data at all or adjust for just a few demographics. When evaluating these polls, look for evidence that the pollster has thought carefully about these kinds of problems and taken steps to correct them.
When it comes to opt-in online polls, enormous sample sizes aren’t necessarily a sign of quality.
Perhaps surprisingly, Center research found that having a sample that looked demographically representative of the country (through use of quotas or weighting) did not predict accuracy. In other words, just getting the survey to look representative with respect to age, sex, etc. does not mean that the survey estimates for other outcomes are accurate. At this stage in their development, opt-in polls require a very thoughtful, hands-on effort for those fielding the survey, requiring them to consider what they are trying to measure and how the characteristics of the sample may interact with those concepts. As a result, consumers of these polls should also be particularly attentive to these issues.
One last “false flag” to ignore: When it comes to opt-in online polls, enormous sample sizes aren’t necessarily a sign of quality. Given that opt-in surveys are so cheap to field, it’s not hard to drive up a sample size to provide the illusion of precision. But Center research suggests that an 8,000 person opt-in survey is not necessarily more accurate than a 2,000 person survey.
The bottom line for now is that, at least in our own explorations, “even the most effective adjustment procedures were unable to remove most of the bias”9 from opt-in polls. That said, the level of precision these opt-in panels can provide may be adequate for some research purposes.
What does this mean for ‘horse race’ polling?
When political types talk about “horse race polling” or “horse race journalism,” they are referring to the measurement or coverage of which candidate is leading in a campaign. This basic human desire to know who is ahead is nothing new, of course, and predates the invention of polling. But the existence of polls has created a robust, ongoing debate over how much time and effort reporters and pollsters should devote to the horse race and what, if any, consequences that has for how the public engages with and understands politics.10
In 2016, Pew Research Center renewed its commitment to covering U.S. national elections but shifted its strategy to deemphasize tracking and reporting on the ups and downs of the horse race. This doesn’t mean we’ll never ask Americans who they currently prefer in the race for president. Understanding the shape of the party coalitions, as well as their differing values and priorities, requires asking Americans who they are thinking of supporting in November 2020. But the pace and emphasis of our work is leading us to place most of our energy elsewhere.
Are aggregators better than single polls?
The past several decades have seen the rise in popularity of the polling aggregator. These news websites build on the premise that more data is better than less data. They collect all the polls being publicly released for national and state races and provide a moving average of the horse race.
We’re not in the business of either aggregating polls ourselves or serving as a frequent horse race data donor. But as public pollsters, we are often asked about how to use and understand the aggregators. Our best advice is this: There is definitely something helpful about looking at a range of data. As social scientists, we like to look for patterns in the data and to scan multiple polls to see if they are saying the same thing. Aggregators help people to do that.
As social scientists, we like to look for patterns in the data and to scan multiple polls to see if they are saying the same thing.
That said, the downside is that it can be challenging to know if all the ingredients in a stew of polls are equally nutritious. This is particularly true when the barriers to entry in the polling field are lower than ever. It also requires readers to keep a close eye on the population of the Americans being represented, including whether they are self-reported registered voters or the generally more conservative-leaning subgroup of people considered most likely to vote (and, even here, pollsters vary in how they define “likely voters”).11
Survey aggregators provide a service in bringing the breadth of data together, but we recommend that readers not take the overall distillation into a single number as gospel. The best aggregators give you tools to engage with the data more closely, to track individual polls or different types of polls separately, and to understand how much of the movement is signal and how much might just be noise.
What about election forecasts and probabilistic models?
Some analysts use data from multiple sources (aggregated survey data, data from prior elections, economic data and more) to develop forecasts of election results in advance of actual voting. These forecasts often are communicated in probabilistic terms (e.g., Candidate X has a one-in-seven chance of victory).
Since election modeling and forecasting are fundamentally about gauging the state of the horse race, disagreements about how these types of forecasts should be covered in the news are a component of the larger debate around horserace coverage. In addition, there is a debate over the extent to which audiences understand what these models are conveying.
Exploratory research suggests that communicating probabilistically may lead people to underestimate the closeness of a race (for instance, “Trump is 60% likely to be reelected” may erroneously be read as “60% of voters back Trump”) and could have the potential to lower turnout. As the AAPOR ad hoc committee recommended post-2016, “greater caution and humility is in order” in 2020. As with aggregated polling figures, these forecasting models can serve as a viable “finger in the wind” about which way fortunes are blowing, but the way they communicate (for example, offering probabilities down to decimal points) probably far overstates the level of precision they can actually offer.
Stay tuned
The 2020 election cycle hits at an interesting moment for the polling industry, as survey researchers work to adapt their methodologies to suit the technological and cultural moment even as the appetite for polls seems as bottomless as ever.
Here at Pew Research Center, we will continue laying down at least two relevant tracks of methodological research. On the methods front, we are pushing forward with our work to understand the strengths and limitations of these newest contenders for attention, the online opt-in polls. We are also working to understand and refine the online probability panel that now carries much of our domestic work.
On the topical content front, we are focused on understanding the deeper currents of politics in a changing nation, continuing to measure America’s partisan abyss, monitoring the public’s confidence in the functioning of democracy and assessing views on America’s role in the world, among other important subjects.
Acknowledgments
This report was made possible by The Pew Charitable Trusts. Pew Research Center is a subsidiary of The Pew Charitable Trusts, its primary funder.
This report is a collaborative effort based on the input and analysis of the following individuals:
Research team
Claudia Deane, Vice President, Research
Courtney Kennedy, Director, Survey Research
Scott Keeter, Senior Survey Advisor
Arnold Lau, Research Analyst
Nick Hatley, Research Analyst
Andrew Mercer, Senior Research Methodologist
Communications and editorial
Rachel Weisel, Senior Communications Manager
Hannah Klein, Communications Manager
Calvin Jordan, Communications Associate
Andrew Grant, Communications Associate
Travis Mitchell, Copy Editor
Graphic design and web publishing
Bill Webster, Information Graphics Designer
Travis Mitchell, Digital Producer
