The political polarization evident in last fall’s presidential election is clearly reflected in the Pew typology. The two most heavily Republican groups Enterprisers and Social Conservatives, who together account for 23% of registered voters supported Bush by margins of 20-1 or more. The strongest Democratic groups Liberals and Disadvantaged Democrats, who together make up 29% of registered voters backed Kerry just as convincingly.
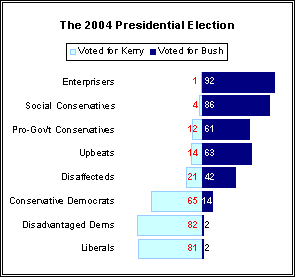
Bush drew strong, but less overwhelming, support from the other largely Republican group, Pro-Government Conservatives. This group, comprising 10% of registered voters, favored the president by five-to-one (61%-12%). On the Democratic side, Conservative Democrats (15% of registered voters) favored Kerry by about the same margin 65%-14%.
Taken together, the three Democratic groups make up a larger share of registered voters than do the three Republican groups (44% vs. 33%). But Bush countered this advantage by drawing strong support from the GOP-leaning groups in the middle of the political spectrum. A majority of Upbeats do not identify themselves with either party, but most lean to the GOP. The Upbeats backed Bush nearly five-to-one (63%-14%). And though many Disaffecteds did not turn out to vote, those who did were also an important part of Bush’s winning coalition (favoring the incumbent by a 42%-21% margin). This group, too, is mostly independent, but 60% either identify themselves as Republican or lean toward the GOP.
Moreover, Bush’s core supporters Enterprisers and Social Conservatives report higher rates of voter turnout than do other groups in the typology. Just 4% of Enterprisers and 6% of Social Conservatives say they did not vote last November. By contrast, 13% in each of the three Democratic groups say they did not vote in the presidential election.
Views of Political Figures
Most Americans (69%) say they would not want Bush to run for a third term, even if that were permissible under the Constitution. Just 27% would like to see Bush serve as president for a third term. A majority also opposes a hypothetical third term for Bill Clinton (55%), but significantly more would like to see a third term for Clinton (43%) than for Bush.
Nearly two-thirds of Americans (64%) have a favorable opinion of Bill Clinton, the highest positive rating of 11 political figures tested. Six-in-ten have a favorable opinion of former New York City Mayor Rudy Giuliani, and about the same number have a positive view of Sen. John McCain (59%).
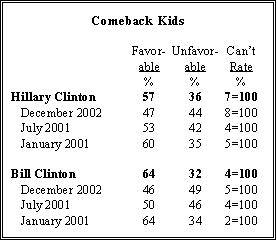
Ratings for both Bill and Hillary Clinton had declined sharply in 2001 and 2002, following the controversy over the pardons Bill Clinton had issued before leaving office. But their ratings have rebounded strongly favorable opinions of Bill Clinton have risen from 46% in December 2002 to 64% currently. Hillary Clinton’s favorable marks have also risen, though not quite as dramatically (from 47% in December 2002 to 57% in the current survey).
The Typology and Leading Republicans
While partisanship also colors the favorability ratings, several political figures have broad appeal across the typology groups. Rudy Giuliani is widely popular with Republican groups, especially Enterprisers (90% positive), but also has a favorable rating among majorities in both independent groups, and roughly half of Conservative Democrats (53%) and Liberals (47%).
Sen. John McCain is extraordinarily popular among Liberals, drawing a positive rating among this group that is actually a bit higher than among Republicans generally (66% vs. 61%). However, his favorability ratings among GOP typology groups are significantly lower than Giuliani’s or those of the president and other administration officials.

Secretary of State Condoleezza Rice is very popular with Republicans her 97% favorable rating among Enterprisers rivals Bush’s (96%) and Cheney’s (94%). But Rice also has robust ratings among both independent groups and among Conservative Democrats. Rice and California Gov. Arnold Schwarzenegger draw the highest positive ratings among Upbeats of all 11 political figures tested (76% each).
Other major administration figures elicit more partisan reactions. Bush has extensive appeal among the GOP groups, as well as among Disaffecteds and Upbeats (72% and 71% favorable, respectively); Bush also earns a 41% favorable mark among Conservative Democrats. But only about one-in-ten Disadvantaged Democrats (9%) and Liberals (9%) express a positive opinion of Bush.
Vice President Dick Cheney’s ratings are generally lower than the president’s, especially among the two independent groups. Donald Rumsfeld has the lowest overall positive rating of the Republicans tested. Fewer than half of those in the independent groups and 52% of Pro-Government Conservatives express a favorable opinion of the defense secretary.
Clintons’ Crossover Appeal
Bill and Hillary Clinton draw positive ratings ranging from 80% to 90% in the three Democratic groups. More surprising is their popularity in the center, and even the center-right, of the political spectrum. Roughly half of Pro-Government Conservatives, whose views stray from GOP orthodoxy more than other Republican groups, express positive opinions of both Clintons (53% Bill Clinton, 51% Hillary Clinton).

Both Clintons are very unpopular with Enterprisers, although about a third of Social Conservatives express a favorable opinion of the former president (32%). However, Hillary Clinton has lower favorability ratings among the two independent groups than Bill Clinton and most leading GOP figures.
John Kerry’s positive appeal is largely limited to the three main Democratic groups. Howard Dean is less well-known, and less popular, than other figures tested. Liberals are the only group in which a majority (60%) expresses a favorable opinion of Dean.
Looking to ’08
John McCain’s extensive popularity among Liberals is evident in early opinions about the 2008 presidential race. Overall, about a third of the public (32%) say they would like to see McCain nominated as the GOP candidate, slightly more than the number who favor Giuliani (27%). But much of McCain’s strength comes from the Liberal group. Fully 55% of Liberals say they most want to see McCain win the GOP nomination; that is more than double the percentage in any GOP group that wants McCain to capture the nomination.
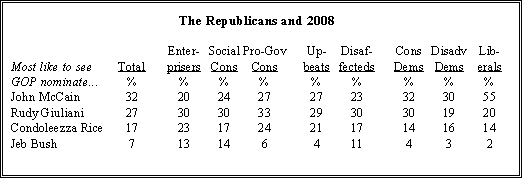
Giuliani’s support, by contrast, is distributed far more evenly across the typology groups. Giuliani is the top choice among the three GOP groups, but also is rated highly by Upbeats, Disaffecteds and Conservative Democrats. Condoleezza Rice also has fairly broad support; among the Republican groups, Rice’s backing is on par with McCain’s. And about one-in-five Upbeats (21%) and Disaffecteds (17%) want Rice to win the GOP nod in 2008.
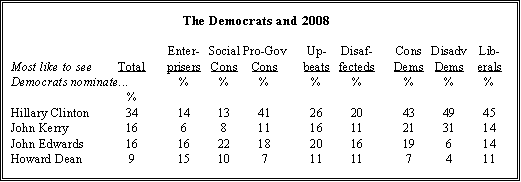
Among Democrats, Hillary Clinton has the early advantage. Clinton is the top choice of all three Democratic groups; overall, about a third (34%) would like to see her win the Democratic nomination. In addition, on the Republican side, 41% of Pro-Government Conservatives want Clinton to win the Democratic nomination. John Kerry and John Edwards both trail Clinton among Democrats, although Kerry attracts sizable backing among Disadvantaged Democrats (31%).
Views of the Parties

As expected, the groups constituting the electoral base for each political party view that party in mostly favorable terms while holding largely unfavorable opinions of the opposing party. When it comes to party performance in standing up for its traditional positions, however, Democratic groups are more critical of their own party’s leadership than Republicans are of GOP leaders. And among the Democrats, Liberals are the most critical of their own party’s leadership.
More than nine-in-ten Enterprisers (96%) have a favorable view of the GOP, and almost as many express a negative view of the Democrats (92%). Social Conservatives are nearly as partisan. However, Pro-Government Conservatives are far less critical of the Democratic party than are the other groups making up the Republican base 38% have a positive opinion of the Democratic Party.
Roughly eight-in-ten members of all three core Democratic groups give their party a favorable assessment. Liberals are the least enthusiastic (77% favorable to 20% unfavorable). Both Disadvantaged Democrats and Conservative Democrats hold similar views of their party, but Conservative Democrats are less negative in their feelings toward the Republican party.
Upbeats and Disaffecteds are less polarized in their views of the two parties. Large majorities in both groups hold favorable views of the GOP but about four-in-ten in each group also hold a favorable view of the Democratic Party (42% of Upbeats, 39% of Disaffecteds).
Party Performance: Liberals Are Critical
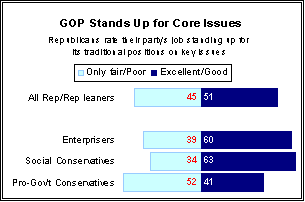
While both parties receive favorable ratings from their base, Republicans are much more positive about the performance of GOP leaders than Democrats are about their party leadership. About half of Republicans and Republican-leaning independents (51%) say GOP leaders are doing an excellent or good job of standing up for traditional party positions, such as reducing the size of government and promoting conservative social values. By contrast, just a third of Democrats and Democratic-leaning independents give party leaders high marks in standing up for traditional Democratic positions, such as helping the needy, representing working people, and protecting the interests of minorities.
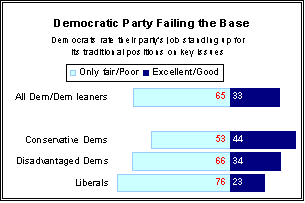
Liberals are particularly negative in their assessment of the Democratic Party leadership. Just 23% of Liberals say the leaders are doing an excellent or good job in standing up for key party stances, while 76% rate their performance as only fair (55%) or poor (21%). Among Democrats, Conservative Democrats are the least critical of the leaders’ performance, with 44% saying they are doing an excellent or good job and a narrow majority (53%) rating their performance as only fair or poor.
Strength of Partisanship
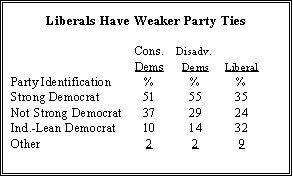
While Liberals are a core part of the Democratic electoral base, and now constitute the largest group in the typology, their identification with the party is the weakest among Democratic groups.
Just 35% of Liberals consider themselves strong Democrats. About a quarter (24%) identify themselves as Democrats but not strongly, and about three-in-ten (32%) are Democratic-leaning independents. This contrasts with both Conservative Democrats and Disadvantaged Democrats, where a majority are strong Democrats (51% and 55%, respectively) and only about one-in-ten are Democratic-leaning independents.
Among Republican groups, 62% of Enterprisers and 51% of Social Conservatives consider themselves strong Republicans. By contrast, only a third of Pro-Government Conservatives are strong Republicans while 28% in this group are Republican-leaning independents.
More GOP Converts
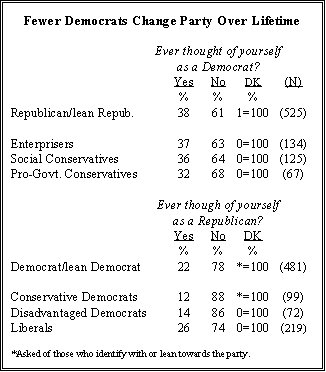
Throughout the 1970s and early 1980s, Democrats outnumbered Republicans in the adult population. The two parties are now at parity with roughly equal proportions identifying with each party. While part of this aggregate shift stems from generational replacement as New Deal-era Democrats have aged and been replaced with younger, more Republican-leaning generations, at least some of the change has resulted from individual changes in party affiliation.
It is not surprising, then, that a sizable minority of Republicans (38%) say that, at some point in the past, they thought of themselves as Democrats. Comparable percentages in the three GOP typology groups say they had a prior allegiance to the Democrats. More generally, older Republicans and Republican-leaning independents (age 50 and older) are more likely to have shifted partisan allegiances than have younger Republicans.
Overall, only about one-in-five Democrats (22%) say they have thought of themselves as Republicans in the past. Liberals are the most likely to have changed party over their lifetime. Only a small portion of Conservative Democrats and Disadvantaged Democrats have thought of themselves as anything but a Democrat (12% and 14%, respectively).
Party Loyalty in the Voting Booth
Majorities in parties have voted across party lines at some point, but more Republicans say they have voted for Democratic candidates than vice versa. Among Republicans, 22% remain loyal while 71% say they vote across party lines. By comparison, 38% of Democrats say they are loyal in their vote, while 56% sometimes cross party lines.
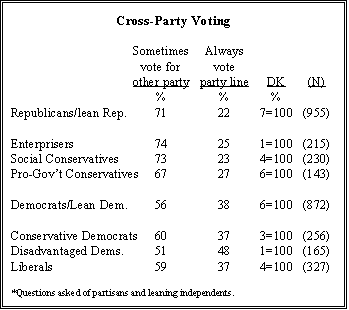
A similar pattern was found in 1987 when 66% of Democrats said they “usually prefer Democratic candidates but I sometimes support Republicans” compared with 77% of Republicans who said they sometimes crossed over to vote for Democratic candidates.
Among typology groups with strong partisan attachments, nearly half of Disadvantaged Democrats (48%) say they always support their party’s candidates, the highest percentage among any group. Somewhat fewer Conservative Democrats and Liberals (37% each) say they always vote Democratic. On the GOP side, only about a quarter of Social Conservatives (23%), Enterprisers (25%), and Pro-Government Conservatives (27%) say they are always loyal to the party in the voting booth.


