Overview
For decades survey research has provided trusted data about political attitudes and voting behavior, the economy, health, education, demography and many other topics. But political and media surveys are facing significant challenges as a consequence of societal and technological changes.
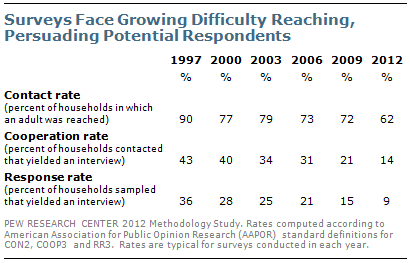
It has become increasingly difficult to contact potential respondents and to persuade them to participate. The percentage of households in a sample that are successfully interviewed – the response rate – has fallen dramatically. At Pew Research, the response rate of a typical telephone survey was 36% in 1997 and is just 9% today.
The general decline in response rates is evident across nearly all types of surveys, in the United States and abroad. At the same time, greater effort and expense are required to achieve even the diminished response rates of today. These challenges have led many to question whether surveys are still providing accurate and unbiased information. Although response rates have decreased in landline surveys, the inclusion of cell phones – necessitated by the rapid rise of households with cell phones but no landline – has further contributed to the overall decline in response rates for telephone surveys.
A new study by the Pew Research Center for the People & the Press finds that, despite declining response rates, telephone surveys that include landlines and cell phones and are weighted to match the demographic composition of the population continue to provide accurate data on most political, social and economic measures. This comports with the consistent record of accuracy achieved by major polls when it comes to estimating election outcomes, among other things.1
This is not to say that declining response rates are without consequence. One significant area of potential non-response bias identified in the study is that survey participants tend to be significantly more engaged in civic activity than those who do not participate, confirming what previous research has shown.2 People who volunteer are more likely to agree to take part in surveys than those who do not do these things. This has serious implications for a survey’s ability to accurately gauge behaviors related to volunteerism and civic activity. For example, telephone surveys may overestimate such behaviors as church attendance, contacting elected officials, or attending campaign events.
However, the study finds that the tendency to volunteer is not strongly related to political preferences, including partisanship, ideology and views on a variety of issues. Republicans and conservatives are somewhat more likely than Democrats and liberals to say they volunteer, but this difference is not large enough to cause them to be substantially over-represented in telephone surveys.
The study is based on two new national telephone surveys conducted by the Pew Research Center for the People & the Press. One survey was conducted January 4-8, 2012 among 1,507
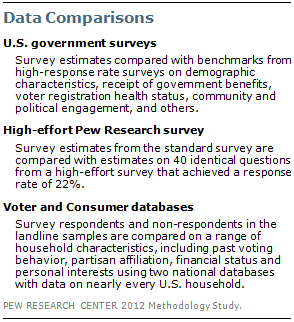
adults using Pew Research’s standard methodology and achieved an overall response rate of 9%. The other survey, conducted January 5-March 15 among 2,226 adults, used a much longer field period as well as other efforts intended to increase participation; it achieved a 22% response rate.
The analysis draws on three types of comparisons. First, survey questions are compared with similar or identical benchmark questions asked in large federal government surveys that achieve response rates of 75% or higher and thus have minimal non-response bias. Second, comparisons are made between the results of identical questions asked in the standard and high-effort surveys. Third, survey respondents and non-respondents are compared on a wide range of political, social, economic and lifestyle measures using information from two national databases that include nearly all U.S. households.
Comparisons with Government Benchmarks
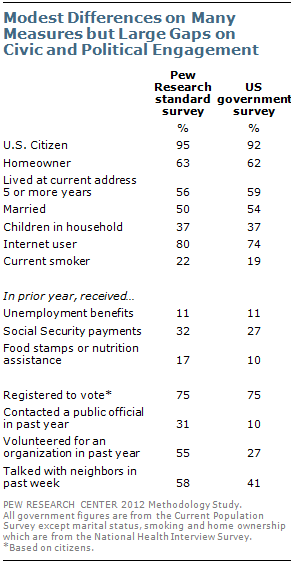
Comparisons of a range of survey questions with similar questions asked by the federal government on its large national demographic, health and economic studies show Pew Research’s standard survey to be generally representative of the population on most items, though there are exceptions. In terms of basic household characteristics and demographic variables, differences between the standard survey’s estimates and the government benchmarks are fairly modest.
Citizenship, homeownership, length of time living at a residence, marital status and the presence of children in the home all fall within or near the margin of error of the standard survey. So too does a measure of receipt of unemployment compensation. The survey appears to overstate the percentage of people receiving government food assistance (17% vs. 10%).
Larger differences emerge on measures of political and social engagement. While the level of voter registration is the same in the survey as in the Current Population Survey (75% among citizens in both surveys), the more difficult participatory act of contacting a public official to express one’s views is significantly overstated in the survey (31% vs. 10% in the Current Population Survey).
Similarly, the survey finds 55% saying that they did some type of volunteer work for or through an organization in the past year, compared with 27% who report doing this in the Current Population Survey. It appears that the same motivation that leads people to do volunteer work may also lead them to be more willing to agree to take a survey.
Comparisons of Standard and High-Effort Surveys
The second type of comparison used in the study to evaluate the potential for non-response bias is between the estimates from the standard survey and the high-effort survey on identical questions included in both surveys. This type of comparison was used in the Pew Research Center’s two previous studies of non-response, conducted in 1997 and 2003.3 The high-effort survey employed a range of techniques to obtain a higher response rate (22% vs. 9% for the standard survey) including an extended field period, monetary incentives for respondents, and letters to households that initially declined to be interviewed, as well as the deployment of interviewers with a proven record of persuading reluctant respondents to participate.
Consistent with the two previous studies, the vast majority of results did not differ between the survey conducted with the standard methodology and the survey with the higher response rate; only a few of the questions yielded significant differences. Overall, 28 of the 40 comparisons yielded differences of two percentage points or less, while there were three-point differences on seven items and four-point differences on five items. In general, the additional effort and expense in the high-effort study appears to provide little benefit in terms of the quality of estimates.
Comparisons Using Household Databases
A third way of evaluating the possibility of non-response bias is by comparing the survey’s respondents and non-respondents using two large national databases provided by commercial vendors that include information on nearly every U.S. household, drawn from both public and private sources.4 An attempt was made to match all survey respondents and non-respondents to records in both the voter and consumer databases so they could be compared on characteristics available in the databases. Very few telephone numbers in the cell phone frame could be matched in either of the databases, especially for non-respondents, and thus the analysis is limited only to the landline frame.
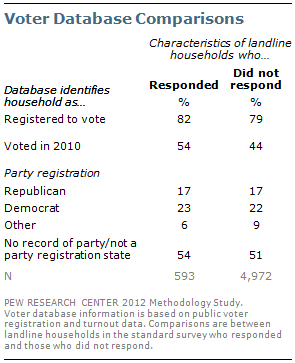
The first database was created by an organization that provides voter data and related services to political campaigns, interest groups, non-profit organizations and academics. It is a continually updated file of more than 265 million adults, including both voters and non-voters. The analysis indicates that surveyed households do not significantly over-represent registered voters, just as the comparison of the survey’s voter registration estimate with the Current Population Survey estimate shows. However, significantly more responding than non-responding households are listed in the database as having voted in the 2010 congressional elections (54% vs. 44%) This pattern, which has been observed in election polls for decades, has led pollsters to adopt methods to correct for the possible over-representation of voters in their samples.
The database also indicates that registered Republicans and registered Democrats have equal propensities to respond to surveys. The party registration balance is nearly identical in the surveyed households (17% Republican, 23% Democratic) and in the non-responding households (17% Republican, 22% Democratic).
The second database used for comparisons includes extensive information on the demographic and economic characteristics of the households’ residents, including household income, financial status and home value, as well as lifestyle interests. This consumer information is used principally in marketing and business planning to analyze household-level or area-specific characteristics.
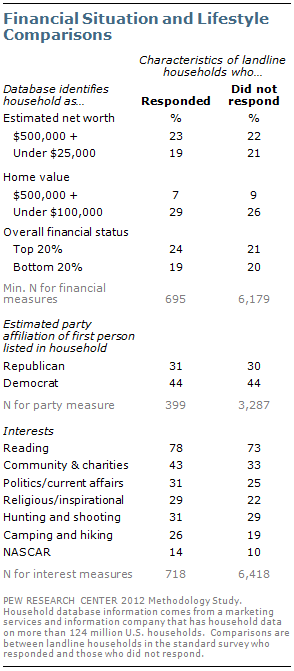
Surveys generally have difficulty capturing sensitive economic variables such as overall net worth, financial status and home values. However, a comparison of database estimates of these economic characteristics indicates that they correspond reasonably well with survey respondents’ answers to questions about their family income and satisfaction with their personal financial situation. Accordingly, they may provide a valid basis for gauging whether, for example, wealthy households are less likely to respond to surveys.
The analysis indicates that the most affluent households and the least affluent have a similar propensity to respond. For example, households with an estimated net worth of $500,000 or more make up about an equal share of the responding and non-responding households (23% vs. 22%). Similarly, those estimated to have a net worth under $25,000 are about equally represented (19% in the responding households vs. 21% in non-responding households). A similar pattern is seen with an estimate of overall financial status.
The database includes estimates of the partisan affiliation of the first person listed in the household. Corroborating the pattern seen in the voter database on party registration, the relative share of households identified as Republican and Democratic is the same among those who responded (31% Republican, 44% Democratic) and those who did not respond (30%, 44%).
Some small but significant differences between responding households and the full sample do appear in a collection of lifestyle and interest variables. Consistent with the benchmark analysis finding that volunteers are likely to be overrepresented in surveys, households flagged as interested in community affairs and charities constitute a larger share of responding households (43%) than all non-responding households (33%). Similarly, those flagged as interested in religion or inspirational topics constituted 29% of responding households, vs. 22% among non-responding households.


