Amid slowing immigration to the United States, there has been a modest shift in views of immigrants. While most Americans still back tighter restrictions on people entering this country,
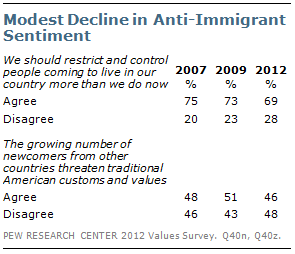
the percentage expressing this view is declining. At the same time, the public is divided over whether the growing number of newcomers from other countries threaten traditional American customs and values. As many now disagree (48%) as agree (46%) with this point of view. Three years ago, a narrow 51%-43% majority saw newcomers as a threat to traditional American values.
Views about black progress also have changed somewhat. About four-in-ten (38%) say that there hasn’t been much real improvement in the position of black people in recent years, while 52% disagree. In 2009, shortly after Barack Obama’s inauguration, 31% took this view and 61% disagreed.
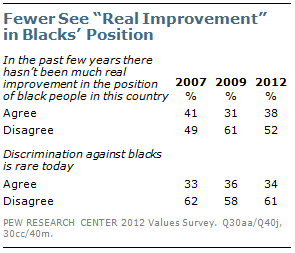
Most continue to disagree with the statement that discrimination against blacks is rare today. And while an 86%-majority says that society should do what is necessary to ensure everyone has an equal opportunity to succeed, there is little support for making every possible effort to improve the position of minorities even if it means preferential treatment. Whites and blacks and partisan groups hold starkly different opinions on the use of preferential treatment to improve the position of minorities.
The single largest shift across the values tracked by the Pew Research Center over the past 25 years comes in views of interracial dating. This was a controversial issue in 1987 when 48% agreed that “it’s all right for blacks and whites to date each other” and 46% disagreed. In the current survey, 86% agree that it’s alright for blacks and whites to date, up slightly from 83% in 2009.
Views of Immigration and Immigrants
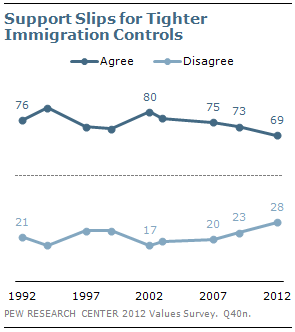
About seven-in-ten (69%) agree with the statement “we should restrict and control people coming to live in our country more than we do now”; 28% disagree. While most continue to favor greater restrictions, the percentage disagreeing with this statement has edged up five points since 2009 and now stands at an all-time high.
Much of the change in views about immigration policy has occurred among Democrats and independents. About six-in-ten Democrats (58%) favor greater restrictions on immigration, compared with 84% of Republicans – largely unchanged in recent years. And three years ago, 77% of independents agreed that greater restrictions on people coming to live in this country were needed. That is down to 69% today.
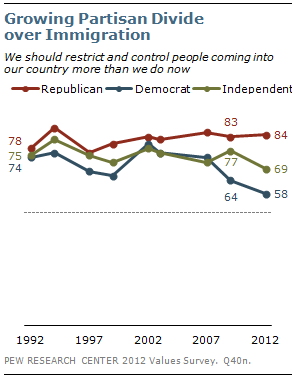
When these questions were first asked twenty years ago, there was virtually no difference between the views of Republicans (78% agree), Democrats (74%) and independents (75%).
Republicans have tended to favor stronger restrictions on immigration, and they feel more strongly about it today than in the past. Currently, 56% of Republicans say they completely agree that we should restrict immigration more than we do now up from 50% in 2009. In 1992, 41% of Republicans strongly supported stronger restrictions on immigration.
The effect of immigration on the nation remains a divisive issue. Overall, about as many agree (46%) as disagree (48%) that “the growing number of newcomers from other
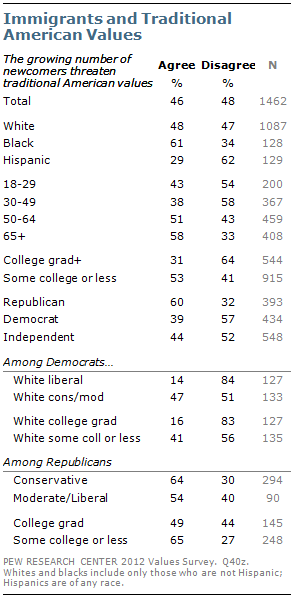
countries threaten traditional American customs and values.” The percentage expressing this view has dropped slightly from 51% three years ago, but there has been no substantial change in these views over the past decade in which the question has been asked.
Six-in-ten (60%) Republicans say that newcomers threaten traditional American customs and values, compared with just 39% of Democrats. As with other measures, this divide has widened. Ten years ago, 54% of Republicans and 50% of Democrats saw the growing number of newcomers as a threat to American values.
Independents’ views have generally been closer to those of Democrats. Currently, 44% say the growing number of newcomers threatens traditional American customs and values, while 52% disagree.
Blacks view newcomers to the United States as more of a threat to American values (61%) than do whites (48%), while very few Hispanics (29%) express this view.
While Democratic views on immigration have shifted in recent years, there remain large differences within the party on this issue. Race and ethnicity are substantial factors, but even among white Democrats there are significant differences of opinion. Just 14% of white liberal Democrats believe immigrants pose a threat to American values, compared with almost half of white conservative and moderate Democrats (47%). Similarly, white Democrats with a college degree reject this idea, while those with less education are more divided.
Education and ideology also are factors within the Republican Party, but to a lesser degree. Opinions among moderate and liberal Republicans do not differ significantly from those of conservative Republicans. Republicans with college degrees are divided over how newcomers affect American values, while those without a college degree see a negative effect.
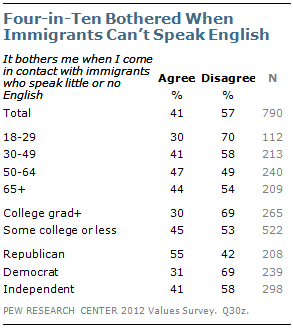
Roughly four-in-ten Americans (41%) agree that it bothers them when they come in contact with immigrants who speak little or no English, while 57% disagree. Non-Hispanic whites are divided on this, with 46% agreeing and 52% disagreeing.
Far fewer 18-to 29-year-olds agree with this (30%) than older age groups, and there is a substantial education gap: 30% of college graduates agree, compared with 45% of those without a college degree.
But as with many other items, the partisan gap is larger than any others. By a slim 55% to 42% margin, most Republicans say it bothers them when immigrants speak little or no English. By a 69% to 31% margin, most Democrats disagree. Independent views are far closer to those of Democrats; 58% disagree and 41% agree.
Attitudes About Race
The perception that blacks have not made progress in recent years has increased modestly since 2009 among the public at large. And African Americans’ views of black progress, which turned less negative between 2007 and 2009, have changed little since then.
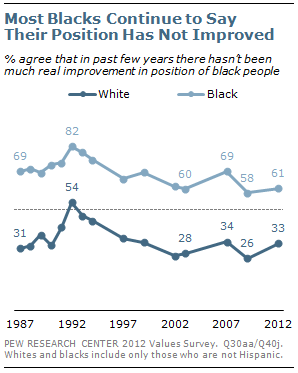
Currently, 61% of blacks say there has been little real improvement in the position of black people in this country. In 2009, 58% of blacks expressed this view; two years earlier, more (69%) said there was not much improvement in blacks’ position.
Meanwhile, more whites say there has been little improvement for blacks than did so in 2009 (33% today, 26% then). The current measure is nearly identical to the 2007 level (34%).
There also continue to be wide partisan differences over perceptions of black progress. Just three-in-ten Republicans say blacks’ position has not shown much improvement, compared with 47% of Democrats, including 43% of white Democrats and 60% of black Democrats.
Views of Discrimination
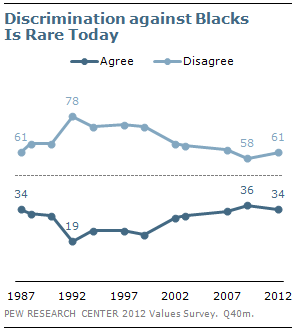
Majorities continue to reject the notion that racial discrimination in this country is rare. Overall, 61% disagree with the statement “discrimination against blacks is rare today,” just 34% agree. Opinion on this question is little changed over the past decade.
Racial and party divides on this question are much more modest than on views of black progress. Majorities of both whites (60%) and blacks (71%) disagree with the statement that discrimination is rare today. And while Democrats (72%) are more likely than other partisan groups to disagree that discrimination against blacks is rare, a majority of independents (61%) and 51% of Republicans also disagree that discrimination against blacks is rare.
Republicans and Republican-leaning independents who agree with the Tea Party, however, are as likely to agree (49%) as disagree (46%) that discrimination against blacks is rare today. By contrast, more Republicans and GOP-leaners who do not agree with the Tea Party disagree that discrimination against blacks is rare (59%) than agree (37%).
Public Rejects Preferential Policies
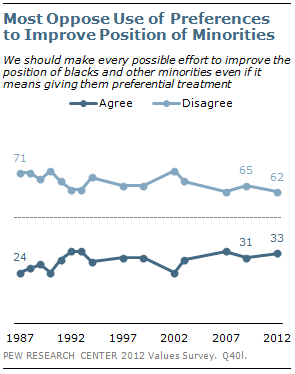
While the public continues to see discrimination against blacks, majorities continue to reject preferential treatment to improve the position of minorities.
About six-in-ten (62%) disagree with the idea that “we should make every possible effort to improve the position of blacks and other minorities, even if it means giving them preferential treatment”; 33% agree. Over the past 25 years, sizable majorities have consistently rejected the use of preferences to improve the position of minorities.
Since 1987, there have been wide racial differences over this issue. In the current survey, 62% of blacks and just 22% of whites say every
possible effort should be made, including the use of preferential treatment, to improve the position of minorities. In the first political values survey, 64% of blacks and 16% of whites expressed this view.
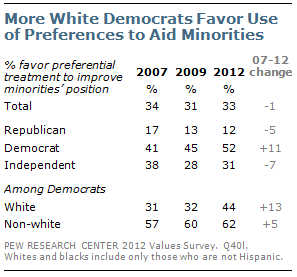
The partisan gap has increased in recent years, largely because of increased support for minority preferences among white Democrats. For the first time in a political values survey, a majority of Democrats (52%) say that every possible effort should be made to improve the position of blacks and other minorities. Democrats’ support for minority preferences has risen 11 points since 2007.
Currently, 44% of white Democrats favor the use of minority preferences up from 32% in 2009 and 31% in 2007. Views of non-white Democrats have shown far less change; in the current survey, 62% of non-white Democrats say all efforts should be made, including the use of preferential treatment, to improve the position of minorities.
There also are sizable age differences in these attitudes. Young people – who are more racially diverse than older age cohorts – are far more likely than older Americans to say that every effort should be made to improve the position of minorities even if it means preferential treatment: 44% say this, compared with three-in-ten of those 30 and older (30%). The age differences are much narrower when only whites are considered: 30% of whites younger than 30 favor the use of minority preferences, compared with 21% of whites 30 and older.
Views of Interracial Dating
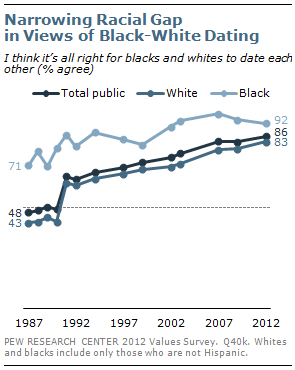
The long-term rise in acceptance of interracial dating has continued in the current survey. Overall, 86% agree that “it’s all right for blacks and whites to date each other,” up slightly from 2009 (83%). The percent who completely agree has risen six points and now stands at 62%.
Racial differences over interracial dating, which were substantial in the first political values survey 25 years ago, have narrowed considerably. In 1987, 71% of blacks and just 43% of whites said it was acceptable for blacks in whites to date. Currently, about nine-in-ten blacks (92%) say it is all right for blacks and whites to date as do 83% of whites. The proportion of whites that finds interracial dating acceptable has nearly doubled since 1987.
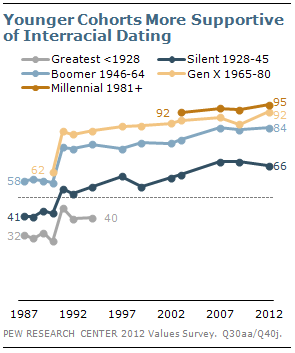
There has long been a generational dynamic in views of interracial dating with younger cohorts more accepting than older cohorts. Millennials (born in 1981 or later) have overwhelmingly found interracial dating acceptable. In the current survey, fully 95% agree that it is all right for blacks and whites to date.
By comparison, two-thirds (66%) of those in the Silent generation (born 1928-1945) do not object to interracial dating, a figure that has held steady for several years. In 2007, 67% of Silents said black-white dating was acceptable.
Democrats (94% agree) continue to be somewhat more accepting of interracial dating than are Republicans (79% agree). However, the percentage of Republicans completely agreeing that interracial dating is acceptable has jumped from 41% in 2009 to 53% in 2012. There has been a more modest increase in complete agreement among Democrats (from 63% to 70%).