The current preferences among voter groups are strikingly similar to those seen on Election Day four years ago. Barack Obama generally leads Mitt Romney among the same groups that
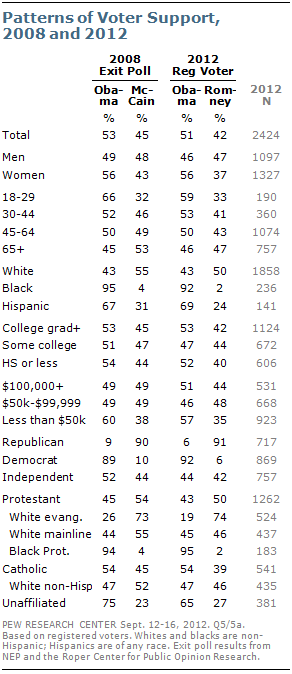
favored him in 2008, and he trails among the groups that supported Republican John McCain.
Obama’s greatest support is found among African American registered voters, who favor him by a margin of 92%-2%; that is comparable to Obama’s 95%-4% margin in 2008. He also runs well ahead among Hispanic voters (69%-24%) and has a 59%-33% advantage among voters under 30. He leads by 65%-27% among those who are unaffiliated with a religion. And Obama has a nearly 20-point advantage among women (56%-37%), while running even among men (46% Obama, 47% Romney).
Four years ago, Obama won the independent vote by a 52%-44% margin. In the current poll he is tied with Romney among independents (44% Obama, 42% Romney). Romney has nearly unanimous support among Republicans (91%), while Obama matches him among Democrats (92%).
There is no indication in the poll that white evangelical Protestants are any less supportive of Romney than they were of McCain in 2008 or George W. Bush in 2004. Romney leads Obama among this group by 74%-19%; McCain beat Obama among white evangelicals by 73%-26%. But Obama is tied with Romney among both white mainline Protestants (45% Obama, 46% Romney) and white non-Hispanic Catholics (47%-46%); McCain edged Obama among both of these groups in 2008.
White Voters Today vs. Four Years Ago
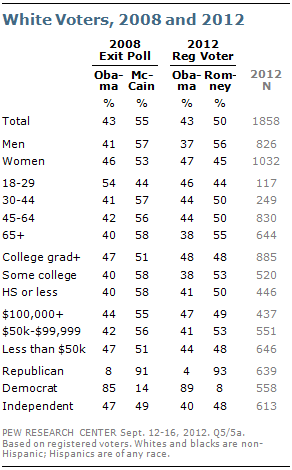
White voters are a critical group for Mitt Romney, given the ongoing decline in the percentage of white non-Hispanic voters in the electorate and the strong support for Obama among non-white voters. He currently holds a 50%-43% lead among whites, which is slightly smaller than McCain’s advantage in 2008. But Romney is doing somewhat better than McCain among younger white voters. Obama beat McCain in this group by 10 points (54%-44%), but is running about even with Romney (46%-44%).
Similarly, Romney leads Obama among white independents (48%-40%). In 2008, Obama battled McCain to a draw among this group (49% McCain, 47% Obama).
While Romney is winning the white working class vote, it is by a smaller margin than four years ago. Romney leads Obama by a 50% to 41% margin among whites who have not attended college. This group favored McCain by a 58% to 40% margin in the 2008 Exit Polls. White college graduates are divided between Obama and Romney (48% back each).
The question of how attitudes about racial and ethnic minorities would affect voter support for Barack Obama has been asked ever since he first appeared as a viable candidate for the Democratic presidential nomination in 2007. Analysis conducted in 2008 found that voters who expressed conservative attitudes on questions dealing with race and ethnicity were less likely to say they would vote for Obama in the general election. This was especially true during the presidential primary amidst the controversy over statements about race by Rev. Jeremiah Wright, Obama’s former pastor. Attitudes about race and ethnicity remain associated with the vote in 2012. But after taking into account partisan affiliation and demographic characteristics, the independent impact of these attitudes on the vote is modest, and no greater now than it was four years ago.
Swing Vote Smaller Than Usual, But One-in-Five Still Not Certain
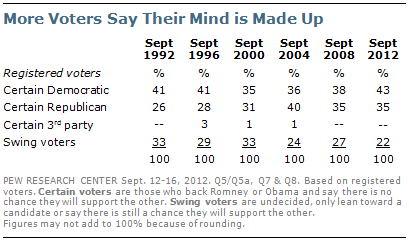
Compared with many previous elections at this point in the campaign, more voters this year say they are absolutely certain to vote for their chosen candidate. Only 22% of registered voters (and 18% of likely voters) can be classified as swing voters (undecided, only leaning toward a candidate, or say there is a chance they might change their mind).
Four years ago, 27% of voters were still open to persuasion at this point in the campaign. Between 1992 and 2000, about three-in-ten voters in September were not yet certain about their choice.
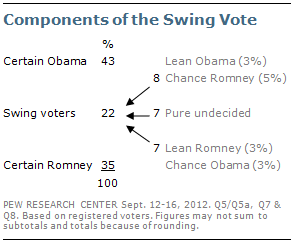
In the current poll, 43% of all registered voters say they are certain to vote for Barack Obama, while 35% say they are certain to vote for Mitt Romney. Among less certain Obama voters, 3% only lean to him and 5% say they might change their mind. Among less certain Romney voters, 3% only lean to the Republican, while 3% say there is a chance they might vote for Obama. Just 7% of voters decline to indicate any preference between the candidates.
Strong Support for Both Candidates Increases
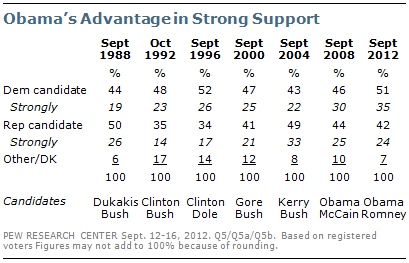
In addition to his overall lead over Romney, Obama also enjoys high levels of strong support among voters. Today, about one-third of all voters (35%) strongly back Obama, while 24% strongly back Romney. Obama’s strong support is among the highest in recent election cycles —comparable both to his strong support in September 2008 (30% strongly) and George W. Bush’s in September 2004 (33% strongly).
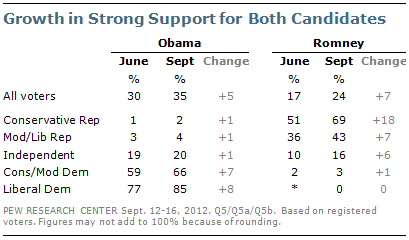
Strong support for Romney also has grown over the last several months. In June, not long after the conclusion of the contentious GOP primary battle, just 17% of voters said they supported Romney strongly; today 24% do so. This rise in strong support for the GOP candidate is evident across Romney supporters and is most pronounced among conservative Republicans–about two-thirds (69%) of whom now say they back Romney strongly, up from 51% in June.
Election about Obama – For Both Supporters and Opponents
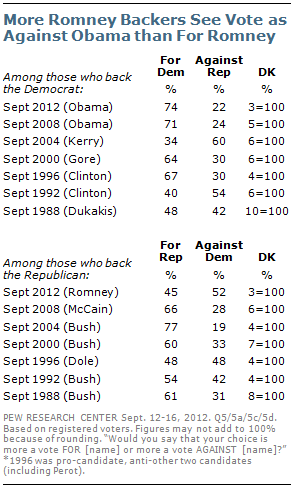
About three-quarters of Obama’s voters (74%) say their choice is more a vote for Obama than against Romney. Obama’s positive support is relatively high and comparable to the positive support among George W. Bush’s backers in 2004 (77% for Bush vs. 19% against John Kerry). Although incumbents typically enjoy more positive than negative support, the proportion of backers who currently say their vote is for him is greater than it was for both Bill Clinton in September 1996 (67%) and George H.W. Bush in September 1992 (54%).
More Romney supporters characterize their vote as a vote against Obama than as a vote for Romney (52% vs. 45%). This is typically the case for challengers to incumbent presidents; Romney’s backers are less anti-incumbent than John Kerry’s were in 2004, when 60% said their vote was primarily against Bush. The last successful presidential campaign with more negative than positive voters was Bill Clinton’s 1992 race; in September of that year, 54% of his supporters said their votes were more against then-president George H.W. Bush than for Clinton.
When asked to give the main reason they want to see Romney win, 38%
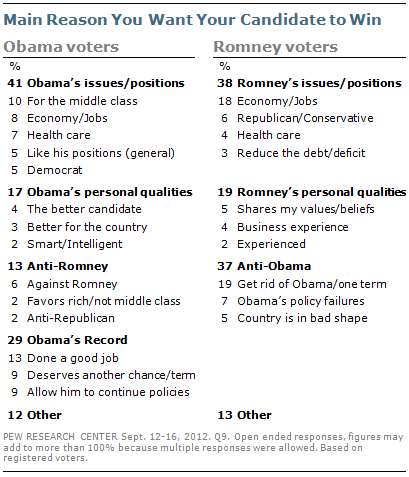
refer to issues they hope he can handle well, such as the economy, health care, and reducing the size of government. But about as many Romney supporters (37%) offer negative assessments of Obama as the main reason for their vote. This is comparable to the third (33%) of John Kerry’s supporters in 2004 who cited George W. Bush as the main reason behind their vote.
Far fewer Obama supporters describe their preference in terms of dislike of Romney. Just 13% cited something negative about Romney in explaining why they want to see Obama win. Roughly four-in-ten (41%) list issues they prefer Obama on, such as his support for the middle class, dealing with the economy, and health care reform. And 29% of Obama voters simply say he has done a good job, or he needs more time, or that he has done enough to deserve another term.