This political typology is the sixth such study, following on previous studies in 1987, 1994, 1999, 2005 and 2011. The typologies developed by the Pew Research Center are designed to describe the political landscape in some detail, going beyond self-identified partisanship or ideology. This year’s typology segments people based on their combination of 23 political values and beliefs. You can find your own place in the political typology using our online interactive.
Our recent report on political polarization, which used the same survey analyzed in this report, found a rise in the share of the public that is consistently liberal or consistently conservative. These across-the-board liberals and conservatives are in full view in the typology, largely found in three loyal partisan groups: Solid Liberals on the left and Business Conservatives and Steadfast Conservatives on the right. The remaining four typology groups also each have a partisan imprint, but people in these groups do not fit as neatly into ideological molds.
However, a significant limitation of the ideological scale used in the polarization report is that it treats political ideology as a single left-right scale. This approach is valuable in terms of tracking levels of ideological consistency over time, but it does a poor job of describing the political “center” other than that they don’t hold consistently liberal or consistently conservative views.
By taking into account a wider range of values, and looking for unique combinations of values, the political typology finds that the political “center” is remarkably fragmented and diverse. In fact, several of the groups that hold a mix of liberal and conservative views are nearly as politically distant from one another as Solid Liberals are from Steadfast or Business Conservatives. For instance, the Faith and Family Left hold liberal positions on the size of government and the social safety net but diverge from other Democratic groups in their degree of social conservatism. By contrast, Young Outsiders, a right leaning group, diverge from the conservative groups in their social liberalism, while holding deeply conservative values about the role of government and the social safety net. Both of these groups are ideologically mixed, but in different ways.
Similarly, though few among either Hard-Pressed Skeptics or the Next Generation Left are ideologically consistent in their political values, and both groups have a Democratic cast, their political values are more different than similar. Hard-Pressed Skeptics are generally isolationist when it comes to foreign policy, and critical of government even as they support the social safety net, while the Next Generation Left favors U.S. engagement with other nations and is generally supportive of government, although lukewarm in its support for the social safety net.
Creating the Typology
The typology divides the public into seven politically engaged groups, along with an eighth group of politically disengaged Bystanders. These groups are defined by their social and political values using 23 survey questions that address attitudes about government, business, privacy, foreign policy, the social safety net, individualism, religion, homosexuality, the environment, immigration and race. These measures are based on broadly oriented values designed to measure a person’s underlying belief about what is right and wrong, acceptable or unacceptable, or what the government should or should not be involved in. The political typology is not based on opinions about political leaders, parties or current issues, nor are demographic characteristics used in its creation.
The current typology is a departure from past typologies, since it does not take partisan affiliation or personal financial circumstances into account in creating the groups. Yet despite the absence of these inputs into the typology, the groups sort fairly cleanly along party lines. The full set of questions—along with more details on how the groups are constructed—can be found here.
Ideological Consistency and the Typology Groups

Solid Liberals, as the name suggests, tend to hold liberal views across all value dimensions. This group is overwhelmingly Democratic: 89% call themselves Democrats or lean toward the Democratic Party, 91% voted for Barack Obama in 2012, and 88% intend to vote Democratic in the 2014 midterms.
Though just 12% of Americans hold consistently liberal positions, Solid Liberals make up the vast majority (82%) of that group; 68% of Solid Liberals are consistently liberal, while an additional 30% are mostly liberal in their political values.
While Democratic candidates can largely count on the support of Solid Liberals, the Faith and Family Left and the Next Generation Left are important, but less reliable, members of the Democratic coalition. Each of these groups has a decidedly Democratic orientation, but they diverge from across-the-board liberal thinking in a number of critical ways that have implications for their loyalty and enthusiasm.
The Faith and Family Left are far more religious and socially conservative than other Democratically-oriented groups. But that is coupled with a strong support for government and a commitment to the social safety net. Overall, 51% of the Faith and Family Left hold about an equal mix of liberal and conservative values, while 38% are mostly liberal in their ideological leanings; just 6% are consistently liberal.
The political values of the Next Generation Left are generally liberal, but they diverge from Solid Liberals in expressing somewhat less support for the social safety net and more positive views of business. In addition, this group’s individualistic streak shows through in its views on race; unlike Solid Liberals, most in the Next Generation Left think that society has made the necessary changes to give blacks and whites equal rights. But in other realms they are deeply liberal; they are supporters of government, environmental protection and have positive views of immigrants. Still, their mix of political values means that in contrast to Solid Liberals, even as 59% are left-of-center (with the remainder holding about an equal number of liberal and conservative positions), just 7% have down-the-line liberal political values.
We utilize a scale composed of 10 questions to gauge people’s ideological worldview. The questions cover a range of political values including attitudes about size and scope of government, the social safety net, immigration, homosexuality, business, the environment, foreign policy and racial discrimination. The scale is designed to measure how consistently liberal or conservative people’s responses are across these various dimensions of political thinking (what some refer to as ideological ‘constraint.’ See Appendix A of the polarization report for more detail.
Two groups: Young Outsiders and Hard-Pressed Skeptics are political wildcards—both are heavily cross-pressured in their core political values, though in distinctly different ways. As a result, members of both groups don’t find either the Democratic or Republican Party a comfortable fit with their mix of beliefs.
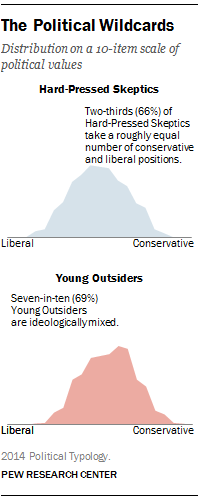
Hard Pressed Skeptics have a Democratic leaning, but their ties to the party are weak; while they voted for Obama over Romney by a wide margin (65% to 25%), they favor Democratic candidates over Republicans by just 14 points (51% to 37%) in the upcoming congressional elections. And despite their 2012 support for Obama, as many now disapprove of his performance as approve.
In contrast to other Democratic-leaning groups, Hard-Pressed Skeptics are distrustful of government and express highly negative attitudes towards immigrants. Yet they are nearly as full-throated in their support for government programs to alleviate poverty as Solid Liberals. This support for the social safety net may reflect their own financial precariousness—Hard-Pressed Skeptics are the lowest-income group in the typology.
Not surprisingly given these competing values, about two-thirds of Hard-Pressed Skeptics (66%) take a nearly even number of liberal and conservative positions across a range of political values; the remaining one-third are equally likely to be mostly conservative (16%) or mostly liberal (17%) in their overall orientation.
The other wild card group, Young Outsiders, is similarly ideologically divided: Most (70%) hold an equal number of liberal and conservative values. And, like Hard-Pressed Skeptics, they are generally deeply distrustful of government. Yet despite sharing the ideological center with the Hard-Pressed, these groups share little else in common.
These Young Outsiders currently gravitate toward the Republican Party based on their fiscal conservatism and distrust of government. Yet, like the Next Generation Left, Young Outsiders tend to be very liberal on social issues, very secular in their religious orientation and are generally open to .
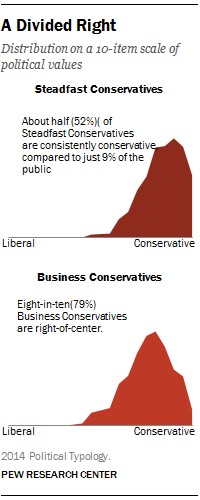
Unlike on the left, where the Solid Liberals are a single, ideologically consolidated bloc, consistently conservative Americans split into two groups in the political typology: Business Conservatives and Steadfast Conservatives. Both groups are overwhelmingly Republican in their political preferences, and are in complete agreement that government should be smaller and play less of a role in the economy. And both groups also express little support for the social safety net, overwhelmingly oppose environmental regulations and take an assertive foreign policy stance.
As a result, nearly all (97%) Americans with consistently conservative values are in one of these groups. Yet there is not wholesale agreement on the political right. Steadfast Conservatives hold very conservative social values and express very negative attitudes about immigrants. Business Conservatives generally view immigrants positively and are moderate—or even liberal—in their attitudes about homosexuality. And while Steadfast Conservatives oppose the government taking an active role in economic regulation, they are also fairly skeptical about the fairness of the free market and the influence large businesses have. By contrast, Business Conservatives hold more conservative views in these realms.
The Typology and Party Affiliation
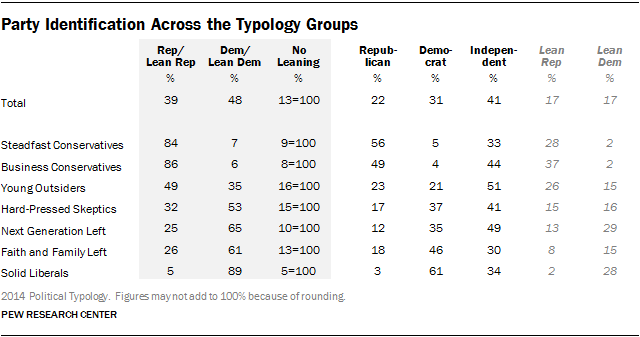
More than eight-in-ten Steadfast Conservatives (84%) and Business Conservatives (86%) identify with or lean to the Republican Party, and 89% of Solid Liberals identify with or lean to the Democratic Party. In their voting behavior, as well as their opinions about the two parties and their leaders, those in these groups are politically “locked-in.”
Other groups are less uniformly Republican or Democratic. While the Faith and Family Left and Next Generation Left are predominantly Democratic, about a quarter of those in each of these groups identify with or lean toward the GOP. Hard-Pressed Skeptics also tilt Democratic, yet 32% are Republican or lean Republican. Young Outsiders are also divided, though with a preference for the GOP: 49% identify with or lean to the Republican Party, while 35% are, or lean, Democratic.
Notably, substantial shares of all seven groups – including the three groups that are near uniform in their political preferences – choose not to identify with a political party. The two youngest groups, the Next Generation Left and Young Outsiders, are the most likely to embrace the independent label. About half of those in both groups call themselves political independents. But more than four-in-ten Business Conservatives (44%) and a third of Steadfast Conservatives (33%), also call themselves political independents, with most of those saying they lean to the Republican Party. And about a third (34%) of Solid Liberals say they are independent, with most of those leaning to the Democratic Party.
How the Typology Groups Vote
Both the groups’ current preferences for the 2014 congressional election and their presidential votes in 2012 closely mirror their partisan makeup. In their preferences for 2014, the vast majority of Solid Liberals (88%) and clear majorities of the Next Generation Left (61%) and the Faith and Family Left (63%) support Democratic candidates.
Hard-Pressed Skeptics also favor Democrats, though by a considerably narrower margin (51% support Democrats, 37% Republicans). On the other side of the aisle, overwhelming majorities of Steadfast Conservatives (88%) and Business Conservatives (88%) favor Republican candidates, while the GOP also enjoys a 20-point advantage among Young Outsiders.
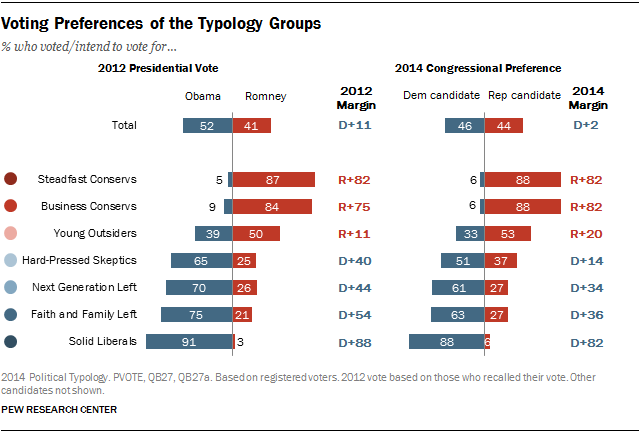
In large part, preferences in this year’s election are similar to vote patterns in the 2012 presidential vote. But the Democratic shares of the votes among several groups—particularly Hard-Pressed Skeptics and the Faith and Family Left—have declined. In 2012, Obama won Hard-Pressed Skeptics by a 40-point margin; Democratic congressional candidates now lead Republican candidates among this group by a much slimmer 14-point margin. And although the Faith and Family Left remains more than twice as likely to vote Democratic this fall, the 54-point margin Obama enjoyed among this group has narrowed to 36 points.
Voting Across Party Lines
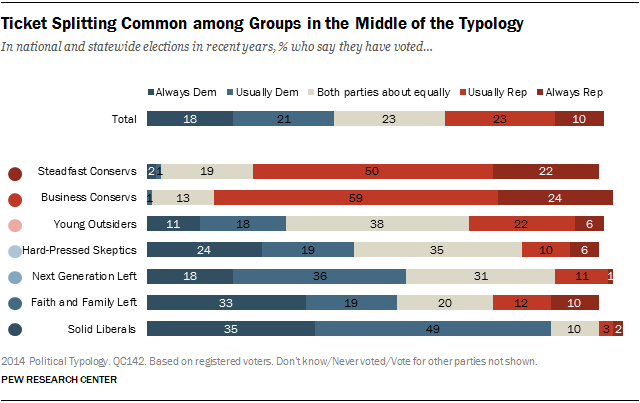
Looking at voting behavior more broadly, Young Outsiders are particularly divided in their political leanings: 29% say they always or usually vote Democratic, 28% say they always or usually vote Republican, and 38% say they vote about equally for both parties. About a third (35%) of Hard-Pressed Skeptics also split their votes about equally between the two parties, though among the remaining two-thirds, far more say they vote Democratic than Republican (42% vs. 16%).
The political loyalty of other left groups is also not universal. Although most of those in the Next Generation Left (54%) say they always or usually vote Democratic, about three-in-ten (31%) say they vote about equally for candidates from both parties, and 12% vote mostly for Republicans. Similarly, 52% of the Faith and Family Left say they always or usually vote Democratic, with another 20% splitting their votes about evenly and a sizeable minority (22%) always or usually voting Republican.
Views of the Tea Party
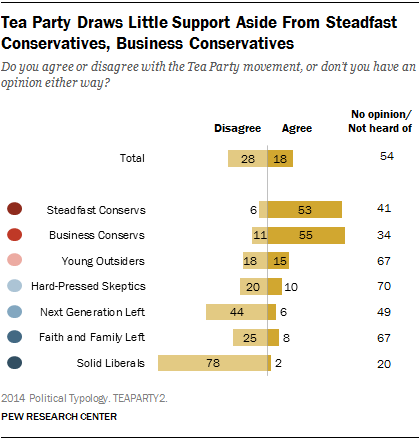
Support for the Tea Party is concentrated about evenly within the two conservative typology groups: 53% of Steadfast Conservatives and 55% of Business Conservatives say they agree with the Tea Party (few disagree, as most others in these groups have no opinion of the movement).
Young Outsiders – the other Republican leaning group – have little affinity for the Tea Party. Two-thirds (67%) have no opinion of the Tea Party, and of those who do, slightly more disagree (18%) than agree (15%) with the movement.
Groups with a Democratic leaning express more disagreement than agreement, although to varying degrees. More than three-quarters of Solid Liberals (78%) say they disagree with the Tea Party. And while 49% of the Next Generation Left have no opinion of the Tea Party, nearly as many (44%) say they disagree with it. Few of the Faith and Family Left or Hard-Pressed Skeptics have an opinion about the movement, though the balance of opinion among those in these groups who do rate the Tea Party is also negative.
Most Groups Support Political Compromise
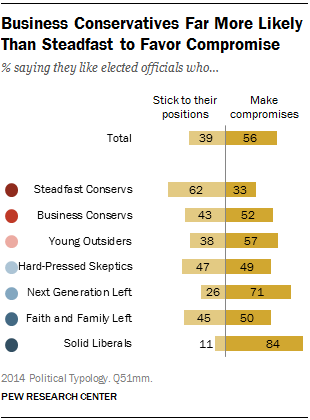
Overall, more Americans say they prefer elected officials who make compromises with people they disagree with than those who stick to their positions (56% vs. 39%). Support for officials who compromise is strongest among Solid Liberals (84%) and the Next Generation Left (71%), while smaller majorities of Young Outsiders (57%) and Business Conservatives (52%) also prefer politicians who make compromises.
Both the Faith and Family Left and Hard-Pressed Skeptics are more divided on the question. And reflecting their name, Steadfast Conservatives stand out as the only group in which a majority (62%) prefers elected officials who remain steadfast, sticking to their positions rather than compromising.
Views of the Parties
To a large extent, views of the two parties mirror the underlying partisan composition of the typology groups. But in some cases, ratings of the two parties reveal a more generalized frustration with politics.
More than eight-in-ten Solid Liberals (83%) have a favorable opinion of the Democratic Party, and 89% view the GOP negatively. About six-in-ten of the Next Generation Left (62%) and the Faith and Family Left (63%) view the Democratic Party positively, with majorities in both of these groups holding an unfavorable view of the Republican Party.
Though a Democratic-leaning group, Hard-Pressed Skeptics are split in their views of the Democratic Party (46% favorable, 47% unfavorable) and have a largely unfavorable view of the GOP (32% favorable, 61% unfavorable). And although they tilt Republican in their preferences, Young Outsiders are the only group with a majority negative view of both the Democratic (59% unfavorable) and Republican (53% unfavorable) parties.
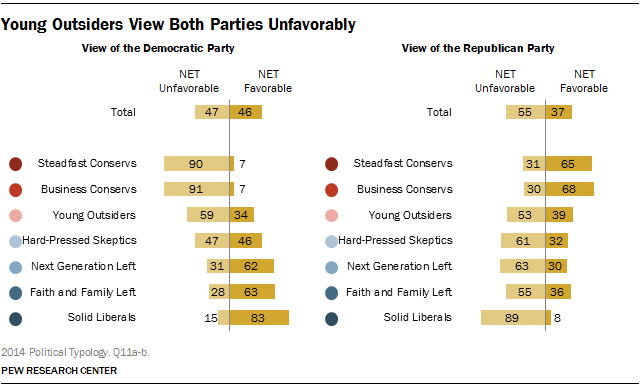
About nine-in-ten Steadfast Conservatives (90%) and Business Conservatives (91%) have an unfavorable opinion of the Democratic Party. Yet despite their strong Republican loyalty, their view of the GOP is muted; about two-thirds in both groups express a favorable view of the Republican Party.
Which Party Cares about Middle Class? More Say the Democrats
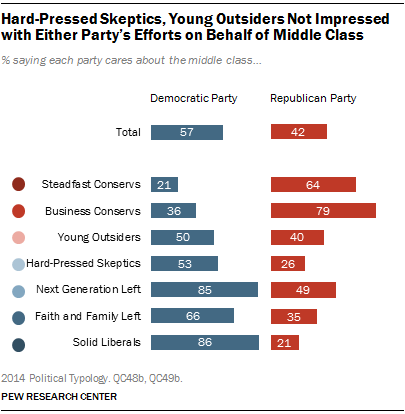
Among the public overall, 57% say the Democratic Party cares about the middle class, while only 42% say the same about the GOP. The Democrats’ advantage on this trait is evident across five of the seven typology groups. Only Steadfast and Business Conservatives give the Republican Party better marks on this measure.
Although both Young Outsiders and Hard-Pressed Skeptics are more likely to say Democrats care about the middle class than to say this about Republicans, neither party performs particularly well on this measure among these groups. Half (50%) of Young Outsiders say the Democratic Party cares about the middle class, while 40% say the Republican Party does. Similarly, about half (53%) of Hard-Pressed Skeptics say the Democratic Party cares about the middle class, though here the GOP lags far behind, as only 26% say the same about the Republican Party.
Critiques of Both Parties’ Approaches to Government
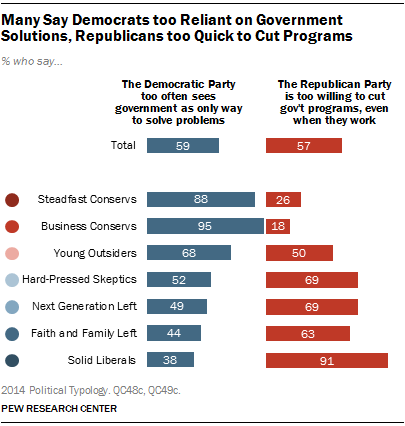
To test views of the parties further, the survey offered two criticisms of the Democratic and Republican parties, which majorities agreed with. About six-in-ten Americans (59%) say the Democratic Party “too often sees government as the only way to solve problems.” Roughly the same share (57%) say the Republican Party “is too willing to cut government programs, even when they work.”
These criticisms of both parties are common in the middle Typology groups. About two-thirds of Young Outsiders (68%) say the Democratic Party is too reliant on government to solve problems, but half (50%) also say that the GOP is too quick to cut working programs. Similarly, while about seven-in-ten (69%) Hard-Pressed Skeptics and those in the Next Generation Left say the Republican Party is too willing to cut programs, about half of those in each of these groups say Democrats too often see government as the solution.
Not surprisingly, the critiques of the other side resonate with the overwhelming majority of Steadfast Conservatives, Business Conservatives and Solid Liberals. But about four-in-ten (38%) Solid Liberals also say the Democratic Party too often relies on government solutions, while a quarter of Steadfast Conservatives (26%) say the GOP is too quick to cut effective government programs.
Polarized Views of Obama
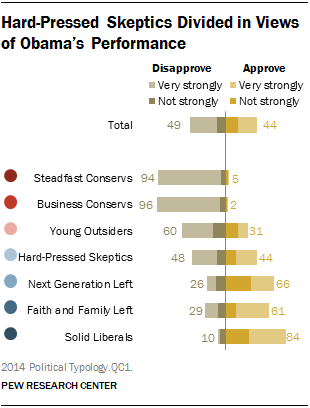
Not surprisingly, views of Barack Obama are highly polarized. Solid Liberals are his strongest supporters; 84% approve of how Obama is handling his job. Obama also fares well among the Faith and Family Left (61% approve) and the Next Generation Left (66% approve). But nearly all Steadfast (94%) and Business (96%) Conservatives disapprove of Obama’s performance—and most of those say they very strongly disapprove. By about two-to-one (60% vs. 31%) Young Outsiders also express more disapproval than approval.
Though Obama won Hard-Pressed Skeptics in 2012, they are currently divided in their evaluations of his job performance: 48% disapprove, 44% approve.
Hillary Clinton Popular with Democratic Groups, Hard-Pressed Skeptics
Hillary Clinton is viewed positively by all four groups with a Democratic tilt. Nearly nine-in-ten Solid Liberals (88%), seven-in-ten in the Faith and Family Left (70%) and Next Generation Left (70%) view her favorably. And while Hard-Pressed Skeptics are split in their views of Obama’s job performance, they hold a favorable impression of Hillary Clinton by roughly two-to-one (62% vs. 32%).
While Young Outsiders are divided in their views of Clinton, (51% favorable, 46% unfavorable), more than eight-in-ten Steadfast (85%) and Business (86%) Conservatives view her unfavorably. And most of those opinions are very unfavorable.
Nancy Pelosi elicits a similarly strongly negative reaction from the two conservative groups: 85% of Steadfast Conservatives and 88% of Business Conservatives have an unfavorable opinion of the House Minority leader—and nearly all of those opinions are very unfavorable. By two-to-one, Young Outsiders also view Pelosi more negatively than positively (57% unfavorable, 19% favorable).
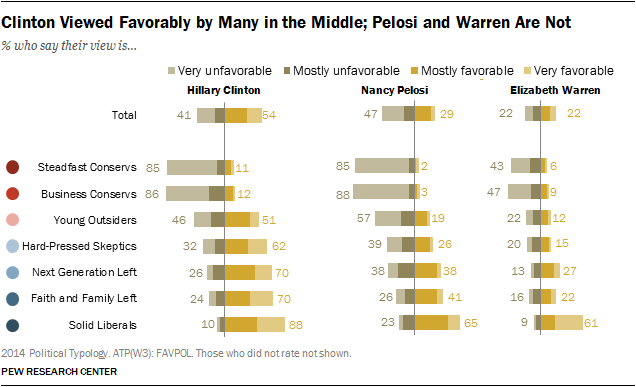
Opinions about Pelosi are largely positive among both Solid Liberals (65% favorable, 23% unfavorable), and the Faith and Family Left (41% favorable, 26% unfavorable), but the former Speaker splits the Next Generation Left (38% favorable, 38% unfavorable), and is in negative territory among Hard-Pressed Skeptics (26% favorable, 39% favorable).
Elizabeth Warren is lesser known among all typology groups, but is broadly liked by Solid Liberals: 61% view her favorably, including 40% saying their opinion is very favorable. In contrast, Steadfast and Business Conservatives give the Massachusetts senator negative marks (while only around half of those in these groups rate her, those ratings are mostly negative). Other groups are both less likely to rate Warren overall, and those who do are more mixed in their views of her, although those in the Next Generation Left view Warren more positively than negatively by about two-to-one.
Cruz Draws Ire of the Left
There is little difference in how many leading Republicans are viewed by the two core GOP groups: Steadfast Conservatives and Business Conservatives. Large majorities in both of these groups have favorable views of Jeb Bush, Rand Paul, Ted Cruz, Marco Rubio and Paul Ryan. Though both groups also view Chris Christie more positively than negatively, a third (33%) of Business Conservatives and 37% of Steadfast Conservatives have an unfavorable view of the New Jersey Governor. But none of these figures find much support from Young Outsiders, many of whom don’t even rate these Republican leaders. Among those who do provide ratings, opinions are divided. And Hard-Pressed Skeptics are also divided over most of these figures.
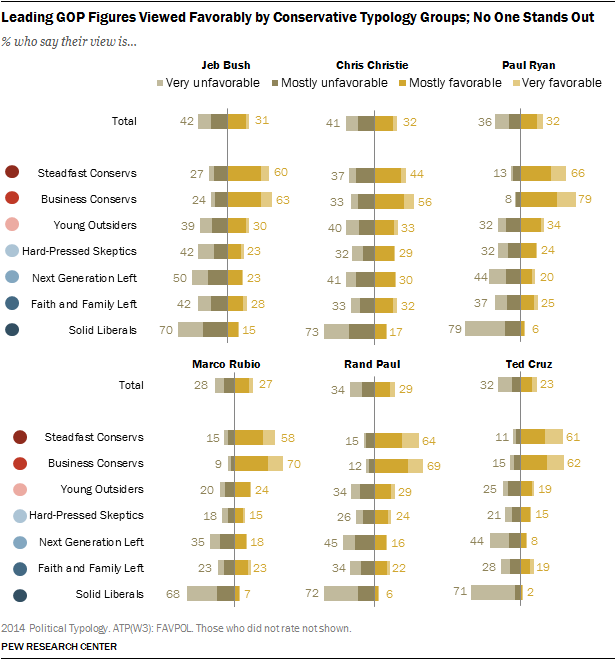
All six of these men elicit unfavorable views from more than two-thirds of Solid Liberals, with many saying their views are very unfavorable. But Ted Cruz stands out as a particular lightning rod for Solid Liberals: 71% view him unfavorably, including 62% who say their view is very unfavorable.