Since the late 1990s, the public’s feelings about the federal government have tended more toward frustration than either anger or contentment. That remains the case today: 57% feel frustrated with the government, while smaller shares either feel angry (22%) or are basically content (18%).
Yet while the public’s sentiments about government have not changed dramatically, Americans increasingly believe the federal government is in need of sweeping reform. Fully 59% say the government needs “very major reform,” up from 37% in 1997.
Overall attitudes about government – from the feelings it engenders to views of its performance and power – are deeply divided along partisan lines. And, like public trust in government, the partisan tilt of these opinions often changes depending on which party controls the White House. However, it is notable that on several measures, including perceptions of whether government is a “friend” or “enemy,” Republicans are far more critical of government today than they were during the Clinton administration.
More are frustrated than angry at government
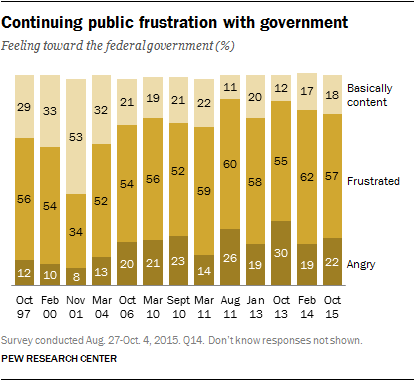
Anger at government is more widespread today than it was in the 1990s. Only on rare occasions, however, do more than about a quarter of Americans express anger at the federal government.
During the partial government shutdown in October 2013, 30% said they were angry at the government – the highest percentage in nearly two decades of polling. Since then, the share expressing anger at government has declined; currently, 22% say they are angry at the government.
Since the late 1990s, majorities have expressed frustration with the federal government – with one notable exception. In November 2001, during the period of national unity that followed the 9/11 terrorist attacks, 53% said they were basically content with the federal government, while just 34% expressed frustration (and only 8% said they were angry).
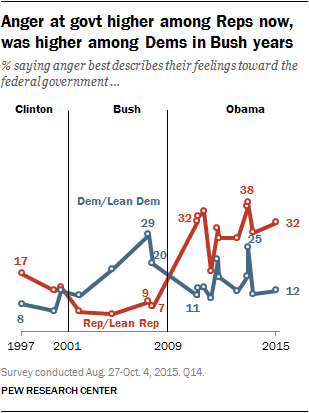
Currently, 32% of Republicans and Republican-leaning independents say they are angry at the federal government, compared with 12% of Democrats and Democratic leaners. The share of Republicans who are angry at government has declined since the fall of 2013 (from 38%); over the same period, anger among Democrats has fallen by about half (from 25% to 12%).
Throughout most of the Obama presidency, a quarter or more of Republicans have expressed anger at the government; during the George W. Bush administration, GOP anger was consistently no higher than 10%. Conversely, Democratic anger at government peaked in October 2006, when 29% expressed anger at government.
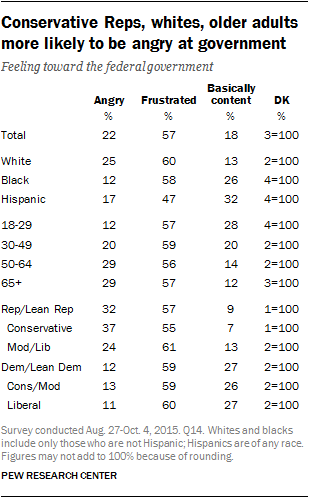
Currently, 37% of conservative Republicans express anger at the federal government, compared with 24% of moderate and liberal Republicans. There are no significant differences in the shares of liberal Democrats (11%) and conservative and moderate Democrats (13%) who are angry at the government.
Among demographic groups, whites and older Americans are especially likely to express anger at the government. A quarter of whites say they are angry at the federal government, compared with 17% of Hispanics and 12% of blacks.
Roughly three-in-ten adults ages 50 and older (29%) say they are angry, about twice the share who say they are content with government (13%). Among those younger than 30, the balance of opinion is reversed — just 12% say they are angry with government, while 28% say they are basically content.
Biggest problem with government? Congress, politics cited most often
Asked to name in their own words the biggest problem with the government in Washington, 13% specifically mention Congress, including 11% who cite gridlock or an inability to compromise within the institution. Nearly as many (11%) name politics and partisanship, while 7% mention the size or scope of government and 6% cite corruption.
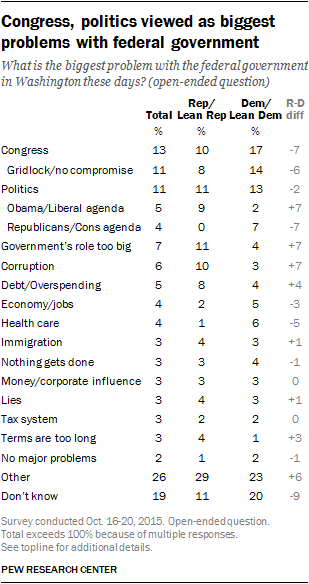
Democrats and Democratic-leaning independents are more likely to name Congress than are Republicans: 17% of Democrats say this, compared with 10% of Republicans.
Among those who call out politics as the biggest problem, several specifically mention those in the opposing party: 9% of Republicans name Barack Obama, Democrats or a “liberal agenda” as the main problem, while 7% of Democrats point to Republicans or a “conservative agenda.”
The size of government and corruption are mentioned more frequently by Republicans than Democrats: 11% of Republicans say government plays too big a role, compared with 4% of Democrats. And while 10% of Republicans mention corruption, just 3% of Democrats do so.
Overall, just 5% of the public cites debt or overspending as the biggest problem with the federal government, while 4% each mention the economy or jobs and health care.
More Republicans (8%) than Democrats (4%) name the deficit and fiscal irresponsibility as the leading problem, while Democrats are somewhat more likely to mention health care (6% vs. 1%).
Most say the government needs sweeping reforms
In 1997, most Americans (62%) said the federal government was “basically sound” and needed only minor reforms or said it needed very little change. Far fewer (37%) said it needed “very major reform.” By 201o, those attitudes had flipped – more said the government needed major reform (53%) than said it was sound or needed little change (45%).
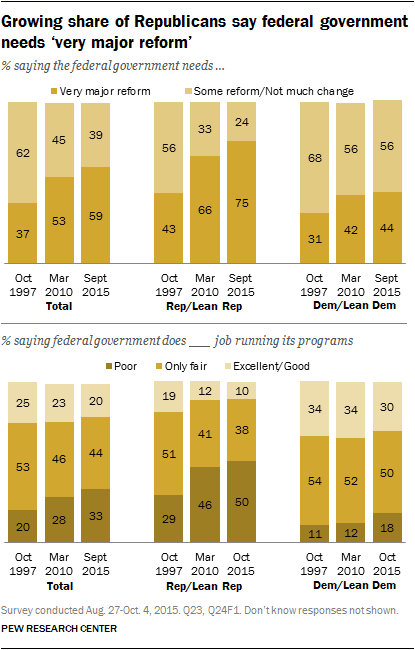
Today, 59% say it needs very major reform, while only 39% say the federal government needs little or no change.
Most of the change since the late 1990s has come among Republicans: Fully 75% of Republicans and leaners now say the federal government needs very major reform, up from 43% in 1997 and 66% five years ago. The share of Democrats saying the government is in need of sweeping reform has risen more modestly since 1997 – 44% now, 31% then – and has barely changed since 2010 (42%).
The public’s overall rating of the government’s performance also has become more negative. Most Americans now say the federal government is doing either an only fair (44%) or poor (33%) job running its programs; just 20% give it an excellent or good rating on this measure.
In 2010, 28% gave the government a “poor” rating for handling programs and 20% did so in 1997. As is the case in views of government reform, the increase in poor ratings for government performance have come almost entirely among Republicans.
Half of Republicans and Republican leaners (50%) now say the government does a poor job running its programs, compared with 46% who said this in 2010 and just 29% who did so in 1997. Conservative Republicans and Republican leaners are particularly likely to rate the government’s performance as poor. About six-in-ten conservative Republicans (59%) say this, compared with 36% of moderate and liberal Republicans. However, moderate and liberal Republicans are not particularly positive about government either: 49% rate its performance as only fair, and just 14% say it is doing an excellent or good job.
Among Democrats and leaners, only 18% currently say the federal government does a poor job running its programs, which reflects just a 7-percentage-point increase since 1997. Half of Democrats (50%) rate government’s performance as only fair, while 30% say it does an excellent or good job.
Is government a ‘friend’ or ‘enemy?’
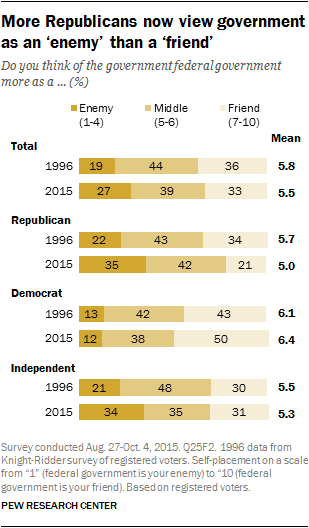
Asked to place themselves on a scale from 1 to 10 “where ‘1’ means you think the federal government is your enemy and ‘10’ means you think the federal government is your friend,” 27% of registered voters say they think of government as an enemy (1-4), up 8 points since 1996. The share of voters who place themselves in the middle of the scale (5-6) has declined from 44% to 39%. A third (33%) currently say they view the government as a friend (7-10), little changed from 36% in 1996.
Today, 35% of Republican voters view the federal government as an enemy, up from 22% in 1996. Similarly, 34% of independents take this view, a 13-point increase from 19 years ago.1
In 1996, Republicans were somewhat more likely to view the government as a friend (34%) than as an enemy (22%). Today, that balance of opinion is reversed: 21% say they see it as a friend, while 35% see it as an enemy.
Half of all Democrats (50%) see the government as a friend; only 12% see the government as an enemy. These views are similar to opinions among Democrats in 1996.
Few think the government is run ‘for the benefit of all people’
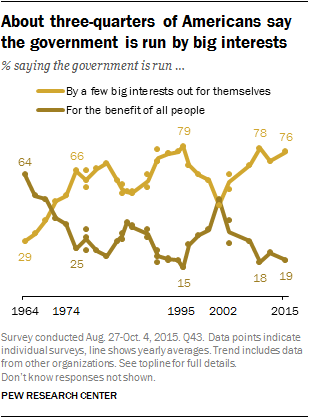
About three-quarters of the public (76%) say the federal government is “run by a few big interests,” while only 19% say the government “is run for the benefit of all the people.” This view is little changed over the past five years, and is on par with views in the early 1990s.
The sense that the government is run by a few big interests has long been the view of most Americans, with majorities consistently saying this for much of the past 15 years (one exception is in 2002, about a year after the Sept. 11 attacks, and a time of relatively high trust in government). Public views of the influence of big interests have largely tracked with movements in public trust in government.
The belief that government is run by a few big interests spans all demographic and partisan groups. Majorities in both parties now say that a few big interests run the government, though this view is somewhat more widely held among Republicans and Republican-leaning independents (81% say this) than among Democrats and Democratic-leaning independents (71%).
Size and scope of government
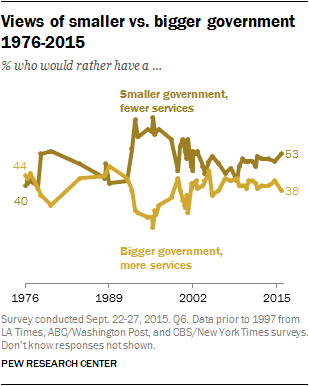
Currently, 53% favor a smaller government that provides fewer services, while 38% prefer a bigger government with more services. These opinions have changed little in recent years, but on several occasions in the 1990s, 60% or more favored smaller government.
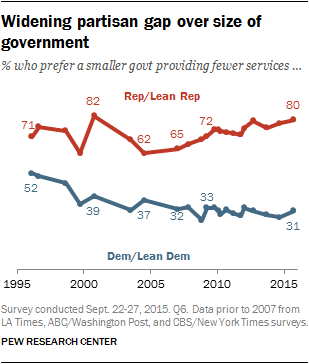
The partisan divide over the size of government is not new, though it is particularly wide today. Eight-in-ten Republicans and Republican-leaning independents (80%) favor a smaller government, 15 points higher than did so in January 2007, while Democratic views have remained largely unchanged (31% favor a smaller government, compared with 32% in 2007).
There also are ideological divisions within each party. Nearly nine-in-ten conservative Republicans (87%) prefer a smaller government, while a smaller majority (71%) of moderate and liberal Republicans say this. And among Democrats, two-thirds (67%) of liberal Democrats prefer a bigger government with more services, but a narrower 53% majority of conservative and moderate Democrats say this (36% prefer a smaller government, with fewer services).
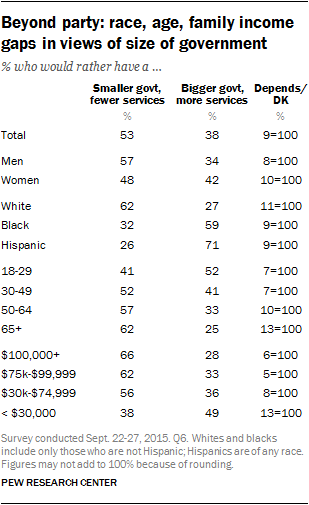
By more than two-to-one (62% to 27%), whites prefer a smaller government that provides fewer services. A majority of blacks (59%) – and an even larger share of Hispanics (71%) – favor a larger government with more services.
About half of 18- to 29-year-olds (52%) would rather have a bigger government providing more services; only a quarter of those ages 65 and older (25%) say this. The gap between older and younger people is seen within parties as well: 35% of younger Republicans favor a bigger government, compared with 6% of Republicans 65 and older. Younger Democrats are more supportive of bigger government than older Democrats (65% vs. 48%).
Lower-income households stand out for their support of bigger government: 49% of those with family incomes of less than $30,000 prefer larger government, the highest share of any income category.
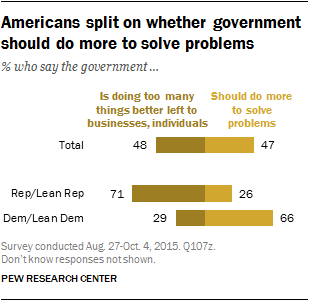
A separate question frames the issue of the scope of government somewhat differently: Should government “do more to solve problems,” or is it “doing too many things better left to businesses and individuals?” The public is evenly divided, as it has been since the question was first asked in 2010: 47% say the government should do more to solve problems, while 48% say it is doing too many things better left to businesses and individuals.
There is a wide partisan gap in views of how much the government should do. Two-thirds of Democrats (66%) say the government should do more to solve problems; 71% of Republicans say it is doing too many things better left to others.
Government viewed as ‘wasteful and inefficient’
The perception of government as wasteful and inefficient has endured for decades. But partisan views of government wastefulness, like trust in government, change depending on which party controls the White House.
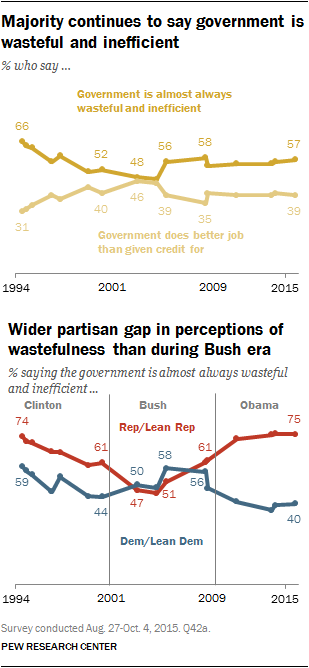
Overall, 57% of Americans say that “government is almost always wasteful and inefficient,” while 39% say it “often does a better job than people give it credit for.” This balance of opinion is largely unchanged over the past decade.
Currently, three-quarters of Republicans fault the government for being wasteful and inefficient. That is little changed from recent years, but higher than the share of Republicans who described government as wasteful during George W. Bush’s administration. Republicans are now about as likely to criticize the government for being wasteful as they were in 1994, during Bill Clinton’s administration (75% now, 74% then).
Just 40% of Democrats view the government as wasteful and inefficient, which is in line with previous measures during Obama’s presidency. Democrats were more likely to say government was wasteful during the Bush administration. However, Democrats were less likely to view the government as wasteful during Bush’s presidency than Republicans have been during most of the Obama and Clinton administrations.
As with other questions about the government’s performance, there are internal ideological divisions within each party in views of government efficiency. Among Republicans and Republican-leaning independents, there is a 15-percentage-point gap between the proportion of conservatives (81%) and moderates and liberals (66%) who say the government is always wasteful and inefficient. And liberal Democrats (64%) are more likely than conservative and moderate Democrats (52%) to say the government does a better job than it gets credit for.
As a career, government viewed as more appealing than politics
Though many Americans express anger or frustration about the federal government, nearly half (48%) say if they had a son or daughter finishing school they would like to see them pursue a career in government.
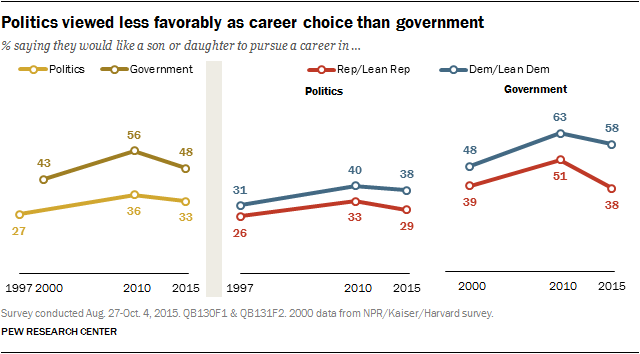
The share saying they would like a child to pursue a career in government is down 8 points since 2010, but careers in government continue to be seen as more appealing than careers in politics: Just 33% say they would like to see a child enter into politics as a career.
Since 1997, Democrats have viewed both political and governmental careers more favorably than Republicans. Though just 38% of Democrats and Democratic leaners would like to see a son or daughter pursue a career in politics, that number falls to 29% among Republicans and Republican leaners.
But partisans are further apart on views about a career in government. Today, a 58% majority of Democrats say they would like to see a child work in government, while just 38% of Republicans say this, a wider partisan divide on this question than in the past.


