 Partisans’ dislike of the opposing party is part and parcel of American politics, but recent years have witnessed a growing intensity in these feelings.
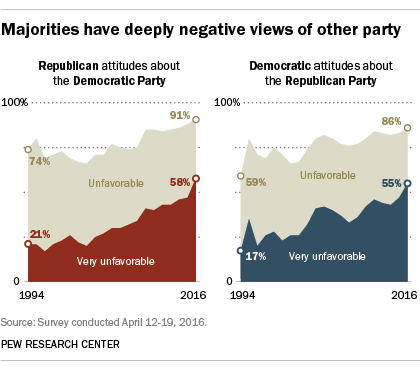
For the first time in more than two decades of Pew Research Center surveys, majorities of partisans have not only an unfavorable view of the other party, but a very unfavorable one. Today, 55% of Democrats and 58% of Republicans view the other party in deeply negative terms.
Intensely negative ratings of the opposing party were far less common in the past, even in presidential election years: In 2000 only about a quarter of both Democrats (23%) and Republicans (26%) had a very unfavorable view of the other party; by 2012 that had risen to more than four-in-ten.
In just the two years since Pew Research Center documented this trend in “Political Polarization in the American Public” in 2014, the share rating the other party very unfavorably has increased by 12 percentage points in both parties.
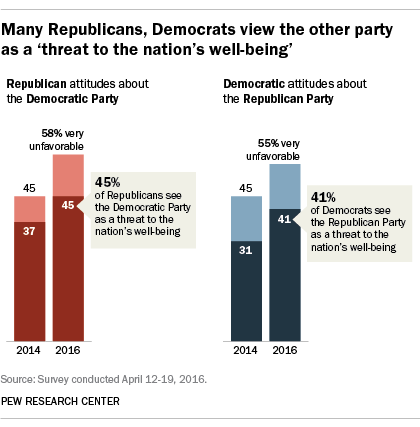 This strong dislike translates into an even greater sense of risk for many on both sides of the aisle. As in 2014, most of those who view the other party very unfavorably say that the opposing party’s policies “are so misguided that they threaten the nation’s well-being.” Still, a larger share now says this: 45% of Republicans now say that Democratic policies threaten the nation, while 41% of Democrats view GOP policies in equally stark terms (up from 31% in 2014).
Views of the opposing party have grown colder over time
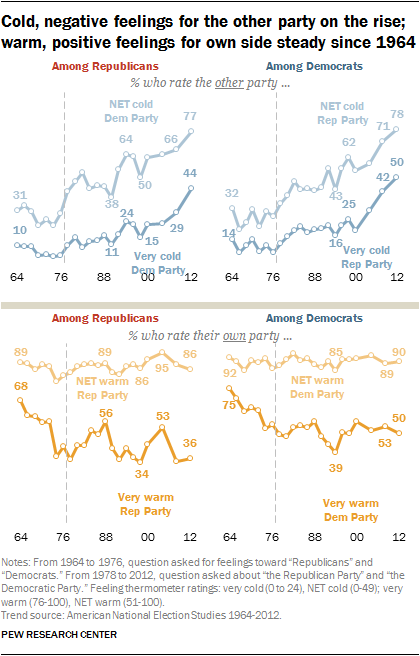 As others have documented, data from the American National Election Studies (ANES) also show an increase in negative feelings about the opposing party. For decades the ANES have asked Republicans and Democrats to rate their feelings toward their own party and the other on a 0-to-100 thermometer scale (a slightly different “feeling thermometer” is used throughout the rest of this report). 1
Since 1964, Republicans’ and Democrats’ feelings toward the other party have grown much colder. The share of both parties with cold feelings toward the opposing party has steadily increased over the past five decades, from around 30% in 1964, to about 45% in 1984, to roughly six-in-ten in 2004; at the time of the most recent ANES in 2012, nearly 80% of Democrats and Republicans alike gave the other party a cold rating.
A significant part of the growth in cold feelings has been the growth of very cold (0-24) feelings for the other side. In 1964, just 10% of Republicans and 14% of Democrats said they felt very cold toward the other side. In 2012, 44% of Republicans and 50% of Democrats were very cold. Over this same period, Americans’ overall warmth toward their own party has been largely stable, but intensely warm feelings are lower than they were in the 1960s and early 1970s.
Feelings toward partisans
In the current survey, when asked to rate a number of groups on a “feeling thermometer” between 0 and 100 – where 0 is the coldest, most negative rating and 100 represents the warmest, most positive – Democrats give Republicans an average rating of just 31, and Republicans give Democrats a similarly low rating of 29.
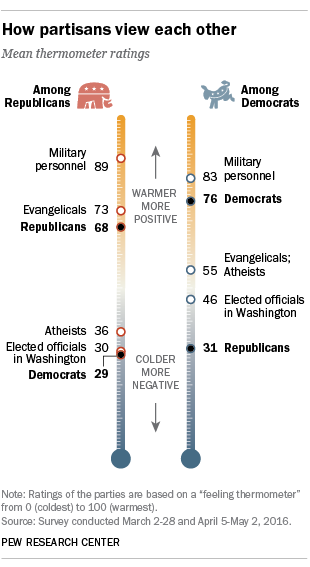 Democrats feel colder toward Republicans than they do toward any other group asked about. Even elected officials in Washington receive an average rating 15 degrees warmer (46) than Republicans. Republicans rate Democrats (29) just as poorly as they do elected officials in Washington (30).
Ratings of members of one’s own party are substantially warmer, though a sizable partisan gap in feelings about one’s own party is evident: On average, Democrats rate members of their own party a 76 on the 0-100 scale, while Republicans give an average 68 rating to their co-partisans.
Although the average rating Republicans and Democrats give to one another is roughly the same, Republicans are somewhat more likely than Democrats to choose a rating for the opposing party that is “cold” (0-49 on the 0-100 scale): 69% of Republicans rate their feelings for Democrats as cold, compared with 61% of Democrats who say this about Republicans.
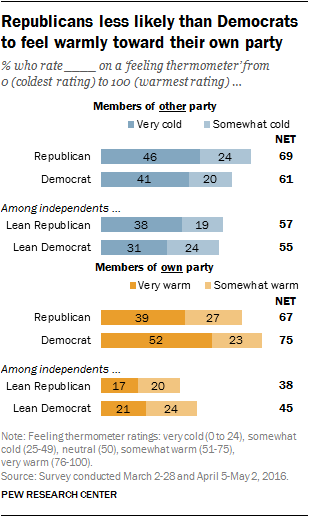 And Democrats are somewhat more likely than Republicans to give members of their own party “warm” ratings (51-100 on the 0-100 scale). Three-quarters of Democrats (75%) give a warm rating to Democrats; about two-thirds of Republicans (67%) feel warmly toward Republicans. Much of the difference comes from a 13-percentage-point gap between the shares of Democrats (52%) and Republicans (39%) who give their co-partisans a “very warm” rating (a rating of 76 or higher).
Compared with self-identified partisans, independents who lean to a party largely share the negative views of the other party, but hold decidedly colder views of the party they lean toward. Though roughly seven-in-ten Republicans (69%) are cold toward Democrats, that falls to 57% among Republican leaners. Nearly as many Democratic leaners as Democrats have cold feelings about Republicans (55% vs. 61%). And while 75% of Democrats give members of their own party a warm rating, just 45% of Democratic leaners give Democrats a warm rating. A similar 29-point gap exists between Republicans (67%) and Republican leaners (38%) in their warm ratings of Republicans.
Politically engaged feel more negatively about those on ‘other side’
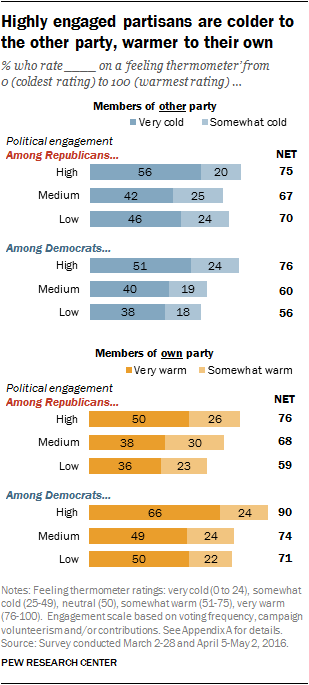 Partisans who are highly engaged in politics – those who nearly always vote and have either donated money to or volunteered for a campaign in the past year – feel more coldly toward members of the other party and more warmly toward members of their own party than people who are less engaged in politics.
Highly engaged Democrats are more likely than less engaged Democrats to express cold feelings about members of the GOP: 76% give Republicans a cold rating, including 51% who give a very cold rating. In comparison, 60% of those who are moderately engaged (regular voters who do not volunteer or give money) give a cold rating, along with 56% of those with lower levels of political engagement.
The relationship between political engagement and coldness toward those affiliated with the opposing party is less striking among Republicans. Highly engaged Republicans are more likely than those who are moderately engaged to express very cold feelings toward Democrats (56% vs. 42%), but are only modestly more likely to express cold views overall (75%, compared with about seven-in-ten among the less engaged).
Engagement is related to warmth toward one’s own side to similar degrees in both parties: 90% of highly engaged Democrats express warm feelings for Democrats, while smaller shares of the moderately engaged (74%) and least engaged (71%) say the same. Two-thirds of highly engaged Democrats (66%) go so far as to give a very warm rating, compared with about half of less engaged Democrats. Among Republicans, there is a similar 17-point gap in warm ratings between the most and least engaged (76% vs. 59%, respectively).
More ideological in both parties are colder to the opposition
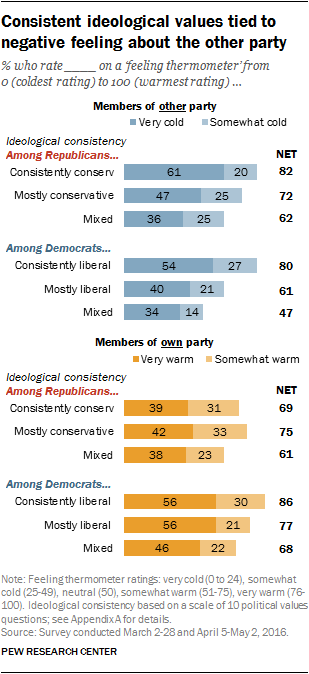 Over the past several decades, not only have views of the opposing party become more deeply negative, but both parties’ members have become more consistently ideological.
The current survey finds that ideologically consistent partisans – Democrats with political values that are consistently liberal and Republicans with values that are consistently conservative – hold some of the most negative views of the other party. 2
Among Republicans, 82% of those with consistently conservative political values say they have cold feelings toward Democrats, compared with 72% of those who have values that are mostly conservative and 62% of Republicans who take about an equal number of conservative and liberal positions.
The pattern is similar – and somewhat more pronounced – among Democrats. Eight-in-ten Democrats who take down-the-line liberal positions feel coldly toward Republicans, on par with the share of consistently conservative Republicans who feel coldly toward Democrats. Far fewer Democrats with mostly liberal positions (61%) feel coldly toward Republicans, and just 47% of Democrats with ideologically mixed views rate members of the GOP coldly.
Among Democrats, those with consistently liberal views are warmer to their party than other Democrats: 86% express warm views of Democrats, compared with 77% of those with mostly liberal views and 68% among those who are ideologically mixed in their views.
But among Republicans, the link between ideology and warmth toward their own party is somewhat weaker. While Republicans with mostly conservative views are more likely to feel warmly toward Republicans than those with mixed views (75% vs. 61%), all Republicans are about as likely to feel very warmly towards their co-partisans: 39% of those with consistently conservative views, 42% with mostly conservative views and 38% with ideologically mixed views feel very warmly toward other Republicans.
Ideology can be measured using one’s political values or based on what people consider themselves to be. Though these measures are correlated, they can differ (for example, not all of those who have consistently liberal political values call themselves liberal). But, as with ideology based on political values, self-identification is also associated with antipathy toward the opposing party. Republicans who self-identify as more conservative are colder toward Democrats and warmer toward Republicans than those who think of themselves as less conservative. A similar pattern is seen among Democrats, with those who are more liberal expressing colder views of the GOP’s membership than those who identify as less liberal.
Antipathy and presidential approval
As Republicans and Democrats have grown more negative in their views of the other party, so too have their evaluations of presidents representing the other party become more critical. Partisan divisions over presidential performance are wider now than at any point since the 1950s, and this growing gap is largely the result of increasing disapproval from the opposition party.
With seven of the eight years of his term completed, Barack Obama’s average approval since taking office stands at just 14% among Republicans, while his average approval among Democrats is 81%. During George W. Bush’s time in office, his average overall approval rating among Democrats was just 23%; on average 81% of Republicans approved of Bush’s performance. (These are averages for the full Bush administration. During his final year in office, an average of just 8% of Democrats approved of his performance, along with 63% of Republicans).
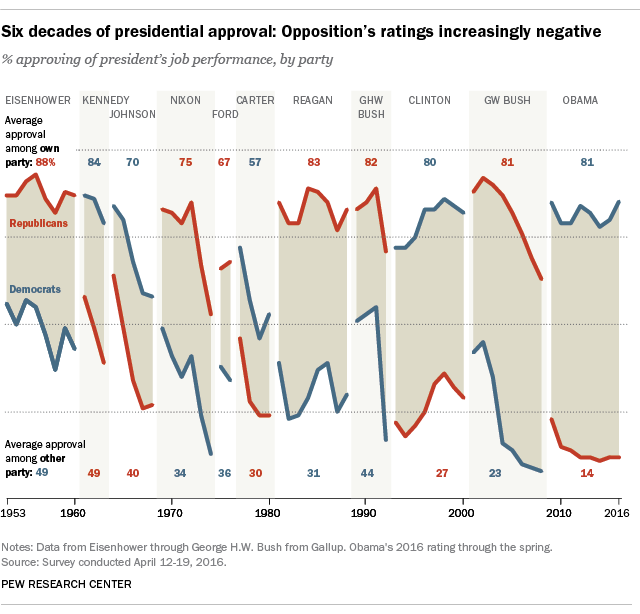 Bush’s and Obama’s polarized job approval ratings stand in contrast to public ratings of previous modern presidents. For example, on average 31% of Democrats approved of Ronald Reagan’s job performance throughout his presidency, while he garnered similar ratings to Obama’s among those in his own party (83% average approval). Just over a quarter of Republicans (27% on average) approved of Bill Clinton’s job performance during his time in office. And going back to Dwight Eisenhower’s administration, nearly half of Democrats (49%), along with 88% of Republicans, said they approved of the job the GOP president was doing in office.


