Currently, 41% of registered voters say they would vote for Hillary Clinton if the general election were held today, while 37% say they would vote for Donald Trump, 10% say they would vote for Gary Johnson and 4% say they would vote for Jill Stein.
Differences in support across demographic groups are largely consistent with preferences at earlier points in this cycle.
There continues to be a sizable gender gap in vote preferences: Women favor Clinton over Trump by 19 percentage points (49% to 30%), while men back Trump by a 12-point margin (45% to 33%). (For more on the gender gap, see “A Closer Look at the Gender Gap in Presidential Voting”).
Educational differences also are substantial, especially among white voters. Overall, voters with postgraduate degrees favor Clinton by a wide margin (59% vs. 21%), with 10% and 5% expressing support for Johnson and Stein, respectively. College graduates also favor Clinton (47% vs. 34%). Preferences are divided among those with some college experience or less: 41% back Trump, 36% favor Clinton (9% say Johnson and 5% Stein).
White voters without a college degree support Trump by roughly two-to-one (51% vs. 26%). By a smaller margin, college-educated white voters support Clinton (47%) over Trump (33%).
And divides across religious groups continue to be wide, as white evangelical Protestant voters overwhelmingly show support for Trump over Clinton in the four-way contest (63% vs. 17%). By contrast, religiously unaffiliated voters are more likely to rally around Clinton than Trump: 56% back her, compared with 19% who support Trump, 13% who prefer Johnson and 5% who would vote for Stein.
Profiling the candidates’ supporters

Gary Johnson is currently backed by 10% of all registered voters in a four-way race. When asked their preference in a two-way race, Johnson backers split evenly: 43% say they would support Clinton in a two-way contest, while 42% would favor Trump.
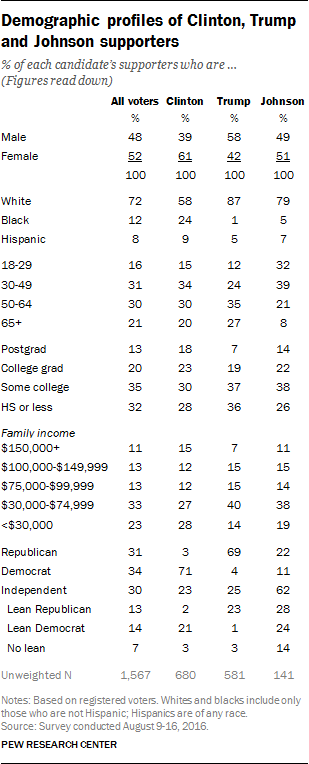
Johnson’s supporters are younger on average than voters who back either Clinton or Trump. Nearly a third (32%) of Johnson’s supporters in the four-way contest are younger than 30. This is roughly double the share of Clinton (15%) or Trump supporters (12%) who are younger than 30. Only 29% of Johnson backers are 50 or older, compared with 50% of Clinton supporters and 62% of Trump voters.
The racial and ethnic makeup of the candidates’ coalitions is also quite different. The overwhelming majority of Trump (87%) and Johnson supporters (79%) are white. By contrast, while a majority of Clinton backers are also white (58%), about a quarter of her supporters are black (24%) and one-in-ten (10%) are Hispanic.
A majority of those who support Johnson are independents (62%) and they are divided roughly evenly between those who lean toward the Republican Party (28%) and the Democratic Party (24%), while 14% decline to lean toward either party. Just 7% of all registered voters – and just 3% each of Clinton and Trump supporters – are independents who decline to lean.
More ‘negative voting’ than in ‘08

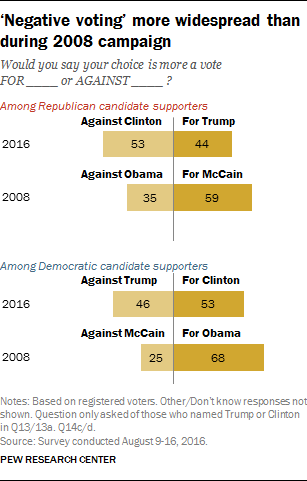
Supporters of both candidates continue to voice attitudes of “negative voting” more now than in the past few presidential cycles. Those who choose Clinton or Trump in the four-way contest express mixed views as to whether their vote is more for their own candidate, or against the opposing candidate.
Among Trump supporters, 44% say their choice is more a vote for Trump than a vote against Clinton, compared with 53% who say their vote is more against Clinton than for Trump. Those who support Clinton are slightly more likely to say their vote is more for the candidate (53%) than to say their vote is against Trump (46%).
Eight years ago, far more supporters said their choice was more a vote for their candidate than said it was a vote against the opposing candidate. In August 2008, 59% of voters who favored John McCain thought of their choice as more for McCain, compared with 35% who said it was a vote against Barack Obama. And fully 68% of those who supported Obama said their vote was more for Obama, more than twice as many as said their choice was more a vote against McCain (25%).


