When voters are asked to grade the candidates, parties and press on how they conducted themselves during the presidential campaign, they award the lowest grades for nearly all involved since the quadrennial post-election surveys began in 1988.

Just 30% of voters give Donald Trump a grade of A or B, 19% give him C, while half grade his conduct at either D (15%) or F (35%). Trump receives a C- grade on average.
Hillary Clinton’s grades are better than Trump’s, which marks the first time a losing candidate has received more positive grades than the winner. Clinton receives an A or B from 43% of voters; 20% award Clinton a C, while nearly four-in-ten give Clinton a D (16%) or F (21%). Clinton’s average grade is a C.
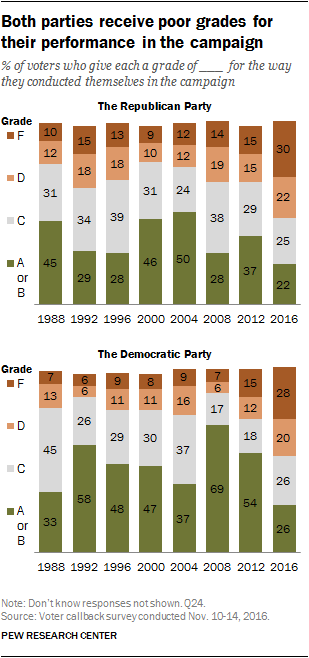
Few voters give high ratings to the political parties. Only about a quarter overall give the Republican Party (22%) and Democratic Party (26%) an A or B; roughly three-in-ten give each of the parties an F (30% for the Republican Party, 28% for the Democratic Party). On average, the GOP receives a D+, while the Democratic Party gets a C-.
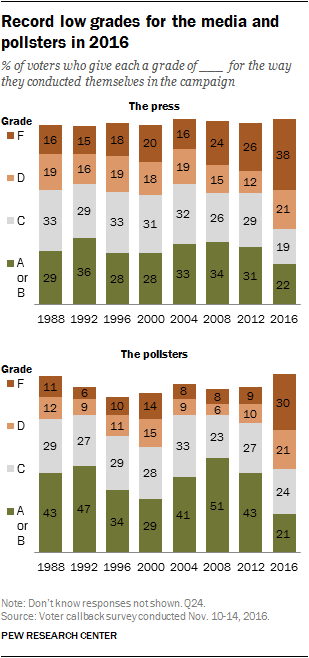
The press and pollsters also are viewed negatively for their performance during the campaign. Only 22% give the press an A or B grade; 38% give them a failing grade. For pollsters, just 21% give them an A or B, while three-in-ten (30%) give them an F.
Voters also are not particularly positive about their own conduct in the campaign. Just 40% say “the voters” deserve a grade of A or B, 29% give them C, 15% D and 13% F. Still, on average, voters give themselves C, which is higher than grades they give other campaign actors aside from Clinton.
Campaign grades 1988-2016

Trump receives historically low grades overall (30% A or B), in part because his own supporters are not all that positive about his campaign conduct. While a majority (58%) of Trump voters give Trump an A or B for his conduct during the campaign, just 17% give him an A.
Barack Obama’s supporters were much more positive about his campaign conduct in 2008 and 2012. In 2008, virtually all Obama voters (97%) gave him a grade of A or B, with 71% giving him an A. In 2012, 91% of Obama voters gave Obama top grades, including 46% who gave him an A.
Trump also gets the lowest grades from supporters of the losing candidate among election winners dating to 1988. Nearly two-thirds of Clinton voters (65%) give Trump a failing grade, by far the highest percentage among the losing candidate’s supporters over this period.
Looking at Obama’s two campaigns, only 12% of McCain voters gave him a failing grade in 2008, while 37% of Romney voters gave Obama an F four years ago. And just 22% of John Kerry’s voters in 2004 gave George W. Bush a failing grade.
Clinton’s overall grades are comparable to Romney’s in 2012 and only slightly worse than McCain’s in 2008. Today, 38% of Trump voters give Clinton a failing grade, similar to the share of Obama supporters who “failed” Romney in 2012 (32%), though just 15% of Obama voters gave McCain an F in 2008.
Both political parties receive their lowest grades ever for their conduct during the campaign. In the past, the party that won the White House was graded more positively than the losing party, but that is not the case this year. (In 2000, the grades for the two parties immediately following the election were nearly identical in the post-election survey conducted several weeks before the outcome was certified.)
Overall, just 26% grade the Democratic Party at A or B, while 22% give the same grade to the GOP; nearly identical shares also “fail” both parties (30% Republican, 28% Democratic).
Although the Republican Party won the White House and retained control of the House and Senate, Trump voters are less positive about the performance of the GOP than Romney’s supporters were four years ago. Just 38% of Trump voters give the GOP an A or B for its campaign conduct. That is much lower than the 58% of Romney voters who gave the party an A or B in 2012, though about the same as the share of McCain voters who did so four years earlier (43%).
About half of Clinton voters (46%) give the Democratic Party an A or B, which is much lower than the share of Obama voters who did so after his victories (81% in 2012, 90% in 2008).
Both parties receive higher failing grades than in past campaigns. This is largely because both Trump and Clinton voters grade the opposing party harshly: 49% of Clinton voters give a failing grade to the GOP, while 46% of Trump voters “fail” the Democratic Party. In 2012, just 32% of Romney voters gave the Democratic Party an F, while 23% of Obama supporters gave a failing grade to the Republican Party.
Negative assessments of the way the press and pollsters conducted themselves in the campaign also are higher than in previous elections.
Overall, 38% of voters give the press a failing grade – including 60% of Trump supporters. Voters who back Republican candidates have long been highly critical of the press, but this marks the first time a majority of any presidential candidate’s supporters has “failed” the press for its campaign conduct. In 2008, 44% of McCain voters gave the press a grade of F, as did 45% of Romney voters four years ago.
Clinton supporters grade the press much more positively. Nearly four-in-ten (38%) give the press an A or B, 26% grade it at C, 20% at D and just 15% give it a failing grade. Still, fewer Clinton supporters give the press an A or B when compared with Obama supporters in 2008 (53% A or B) and 2012 (48%).
And voters offer very negative evaluations of the pollsters. Only 21% of voters give the pollsters a grade of A or B, while 30% give the pollsters an F for their performance. That is the highest percentage giving the pollsters a failing grade in any election dating to 1988.
These low marks for pollsters are shared by Clinton and Trump voters. Only 17% of Trump supporters and 24% of Clinton supporters give pollsters an A or B grade, while about a third (36%) of Trump supporters offer an F, as do 26% of Clinton voters.
As is almost always the case, “the voters” receive lower grades from supporters of the losing candidate than from those who back the winning candidate. Just 27% of Clinton supporters give the voters a grade of A or B; by contrast, a majority of Trump backers (55%) give top grades to the voters.
However, Trump supporters are not as positive about the performance of the voters as Obama supporters were in 2008 (83% A or B) or 2012 (70%). For their part, Clinton voters give the voters lower grades than McCain voters did in 2008 (43% A or B), and about the same grades as Romney supporters gave to the voters in 2012 (29%).
Low satisfaction with voting choices
Voters’ satisfaction with the choice of presidential candidates is at its lowest point for any of the last eight presidential elections. And for the first time in this period, a majority of voters (55%) say that ultimately they were not satisfied with their choices for president. Just 44% expressed satisfaction with their options.
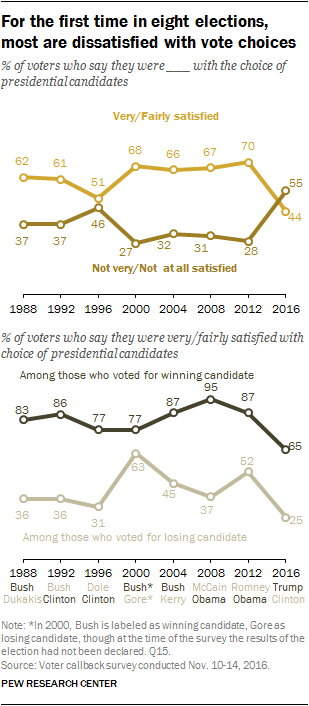
In each of the four elections going back to 2000, two-thirds or more of voters expressed satisfaction with the candidates. In 2012, 70% of voters said they were satisfied with their choices; just 28% were not very or not at all satisfied.
This perspective may have set in early with 2016 voters. In June, registered voters expressed comparably sour views on their choices. Just 40% said they were satisfied with the candidates in the race.
Among those who voted for Trump, 65% said they were satisfied with the field of candidates, which marks a low point for voters who backed the winning candidate in any recent election. Eight years ago, 95% of Obama supporters said they were satisfied with their vote choices, and 87% of Obama voters did so in 2012.
Supporters of losing presidential contenders consistently express less positive views of the field after elections, but Clinton voters are particularly dissatisfied. Only 25% express satisfaction with their options for president this year. Not since Bob Dole lost to Bill Clinton in 1996 have the supporters of a losing candidate expressed so little satisfaction with their choices. Then, just 31% of Dole’s voters said they were ultimately satisfied with the candidates running.
Campaign viewed as heavy on negative campaigning, light on issues
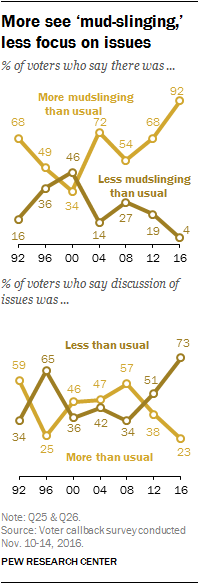
Voters in 2016 found this presidential campaign to be far more negative than past elections and to include far less discussion of issues than usual.
Almost across the board, voters saw this campaign as more negative than past elections. About nine-in-ten (92%) say there was more mudslinging or negative campaigning compared with previous contests, up from 68% who said that in 2012, up 38 points from 2008 (54% more negative) and 20 points higher than the previous high of 72% in 2004.
Trump voters and Clinton voters overwhelmingly agree it was a more negative campaign than previous elections (90% and 95%, respectively).

On issues, about three-quarters of voters (73%) say there was less discussion of issues than in past elections, while just 23% say there was more talk of issues. Not since the 1996 election have so many voters said there was less discussion than in typical campaigns.
Large majorities of both Trump and Clinton voters say there was less discussion of issues than usual, though Clinton voters are more likely to say this (81% vs. 65%).
While most say there was far less discussion of issues, the vast majority of voters (81%) say that they learned enough about the candidates and issues to make an informed choice. The percentage who feels they learned enough to choose a candidate fell slightly from 2012 (87%) but is on par with other recent elections.
About six-in-ten voters (63%) said the presidential debates were very or somewhat helpful in deciding which candidate to vote for. This is similar to voters’ assessments of the debates usefulness in recent elections.
Most voters feel news media had too much influence on election outcome
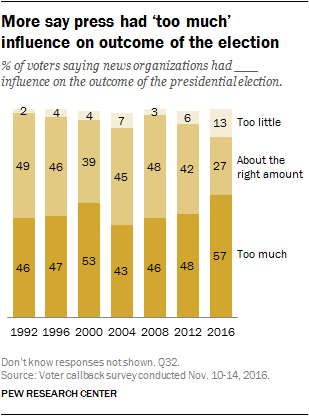
A 57% majority of voters say news organizations had too much influence on the outcome of this year’s presidential election, while 13% say the press had too little influence and 27% say the press had the right amount of influence. The share saying news organizations had too much influence on the outcome of the presidential election is the highest it has been since 2000, while the share of those saying the press had about the right amount of influence is the lowest in Pew Research Center polling going back to 1992.
About half of those who voted for Clinton (50%) say news organizations had too much influence on the outcome of the election. This is nearly twice the share of Obama voters who said that the press had too much influence on the outcome in 2012 (29%) or in 2008 (18%), and higher than the 41% of Kerry voters who said this in 2004.
About six-in-ten Trump voters (62%) say news organizations had too much influence on the outcome of the election. Larger shares of Romney (69%) and McCain (77%) voters said the press had too much influence following their election losses. But in 2004, in the days after George W. Bush’s reelection, just 45% of Bush voters said news organizations had had too much influence.
Fewer Trump voters (20%) than Clinton voters (34%) say news organizations had about the right amount of influence on the outcome of the election, while similarly small shares of each candidate’s voters said the press had too little influence (14% of Clinton voters, 13% of Trump voters).
Voters are critical of how the press treated the candidates
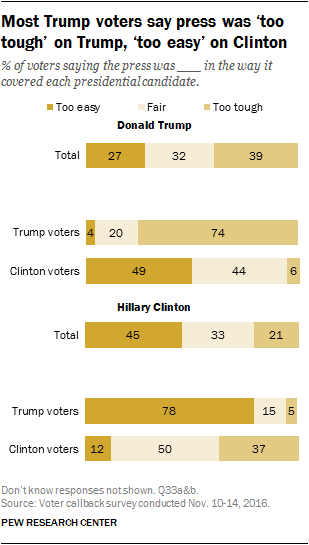
About four-in-ten voters (39%) say the press was too tough in the way it covered Trump’s campaign, while 32% say it was fair and 27% say it was too easy. Overall, voters were more likely to say the press was too easy on Clinton: 45% say this, while 21% say it was too tough on her and 33% say it was fair.
That the press is viewed by voters as having been easier on Clinton and harder on Trump is largely the result of higher levels of press criticism among Trump voters than Clinton voters: About three-quarters of Trump voters say both that the press was too tough on him (74%) and too easy on her (78%). By contrast, Clinton voters are roughly as likely to say the press treated Trump fairly as they are to say it was too easy on him (49% vs. 44%). And while 37% of Clinton voters say the press was too tough on their candidate, half (50%) say she was treated fairly.


