This report describes key findings from an analysis of all official press releases and Facebook posts identifiable via internet and archival sources, issued by members of the 114th Congress between Jan. 1, 2015, and April 30, 2016, prior to either party’s 2016 presidential nominating convention. A total of 94,521 press releases were collected directly from members’ websites and supplemented with additional press releases collected from LexisNexis searches. The 108,235 Facebook posts from members’ official accounts were collected directly from the social media platform’s application programming interface (API) for public pages. To analyze these two collections of congressional statements, Pew Research Center used a combination of machine-learning techniques and traditional content analysis methods. The Center sampled 7,000 press releases and Facebook posts. Researchers and paid content coders then manually classified the sample to create a set of training data. Next, the Center employed an automated approach that approximates human judgments to classify the rest of the documents. Researchers used machine-learning models that estimated the relationship between words used in the documents and human classification decisions to predict the most likely classification for all documents that were not coded by hand. Additional detail can be found in the methodology section. This approach allowed the Center to provide a more comprehensive account of congressional communications than would be possible with a much smaller sample of documents classified by hand. For example, researchers were able to estimate the proportion of communications containing expressions of indignant disagreement for every U.S. senator and representative during this period, allowing for an examination of the relationship between indignation and the political attributes of particular members and their districts. Nonetheless, this process, which was relatively new for the Center, necessarily entails some degree of error in concept operationalization, human judgment, machine classification and statistical estimation. Because of this, the statistics included in this report should be understood as estimates. Just as survey results need to be understood in the context of a margin of error, there is a degree of error associated with the results presented here. Estimates of error are provided in the form of standard error intervals and confidence bands, which are attempts to quantify the uncertainty surrounding each set of statistics. Estimates of reliability in human and error in machine classification are provided in the methodology section at the end of the report.
Hostility in political discourse was thrown into sharp relief in 2016 by a contentious presidential campaign. A new Pew Research Center analysis of more than 200,000 press releases and Facebook posts from the official accounts of members of the 114th Congress uses methods from the emerging field of computational social science to quantify how often legislators themselves “go negative” in their outreach to the public.
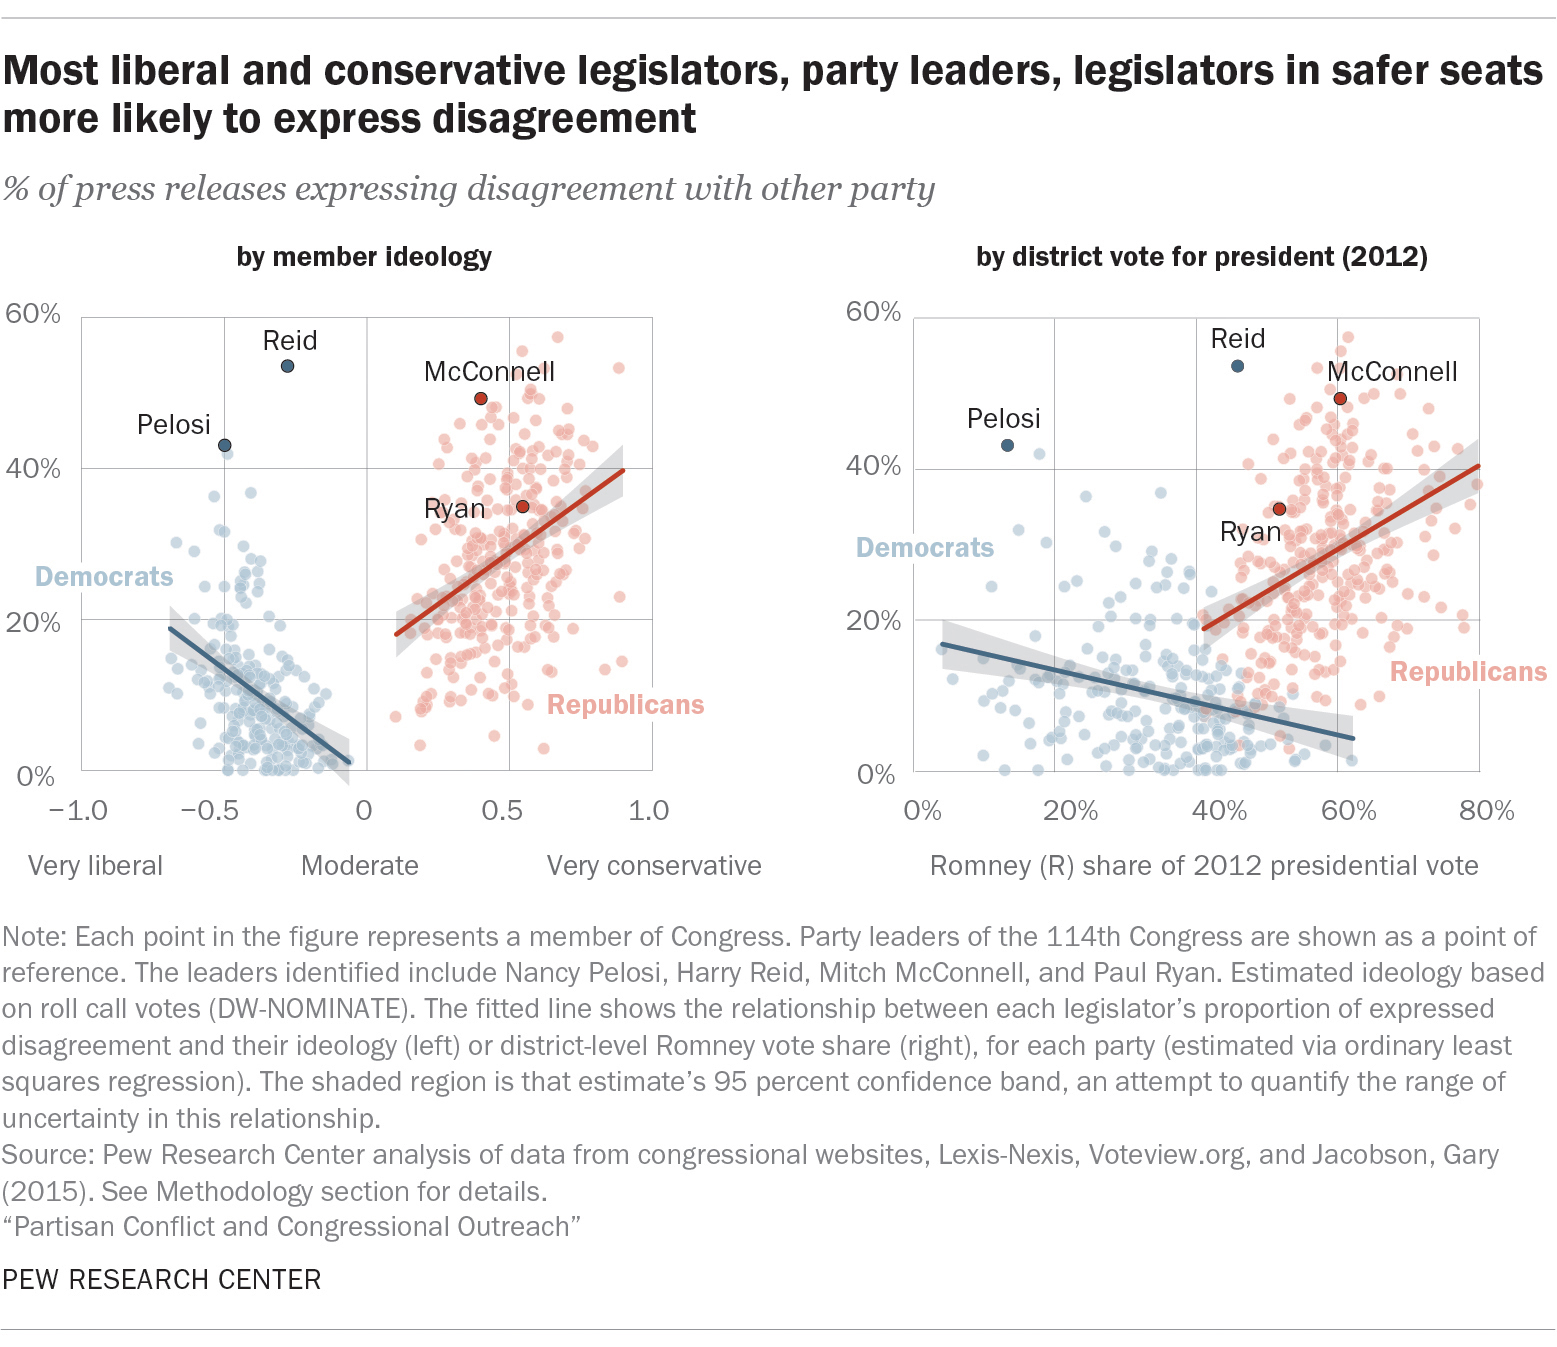
Overall, the study finds that the most aggressive forms of disagreement are relatively rare in these channels. For the average member, 10% of press releases and 9% of Facebook posts expressed disagreement with the other party in a way that conveyed anger, resentment or annoyance. But there are distinct patterns among those who voiced political discord: congressional leaders, those with more partisan voting records and those who are elected in districts that are solidly Republican or Democratic were the most likely to go negative. Republicans, who did not control the presidency during the 114th Congress, were much more likely to voice disagreement than were Democrats. The analysis represents the Center’s most extensive use of the tools and methods of data science to date.

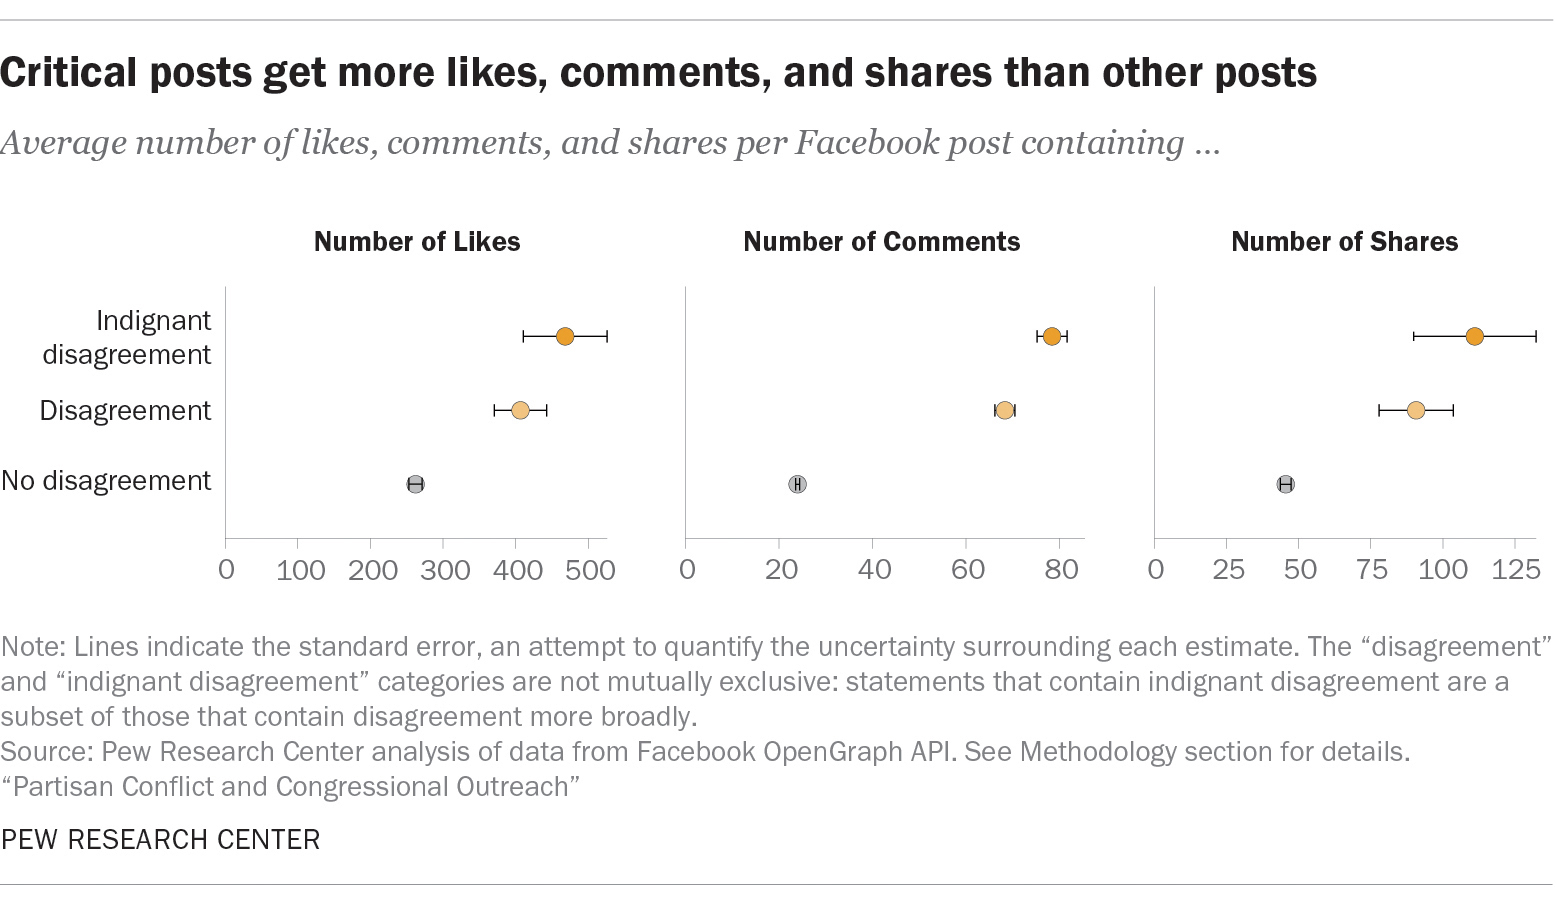
The study also finds that critical posts on Facebook get more likes, comments, and shares.1 Posts that contained “indignant disagreement” – defined here as a statement of opposition that conveys annoyance, resentment or anger – averaged 206 more likes,2 66 more shares and 54 more comments than those that contained no disagreement at all. Other research suggests that, faced with divisive policy rhetoric, audiences tend to adopt the stances of their party leaders.3

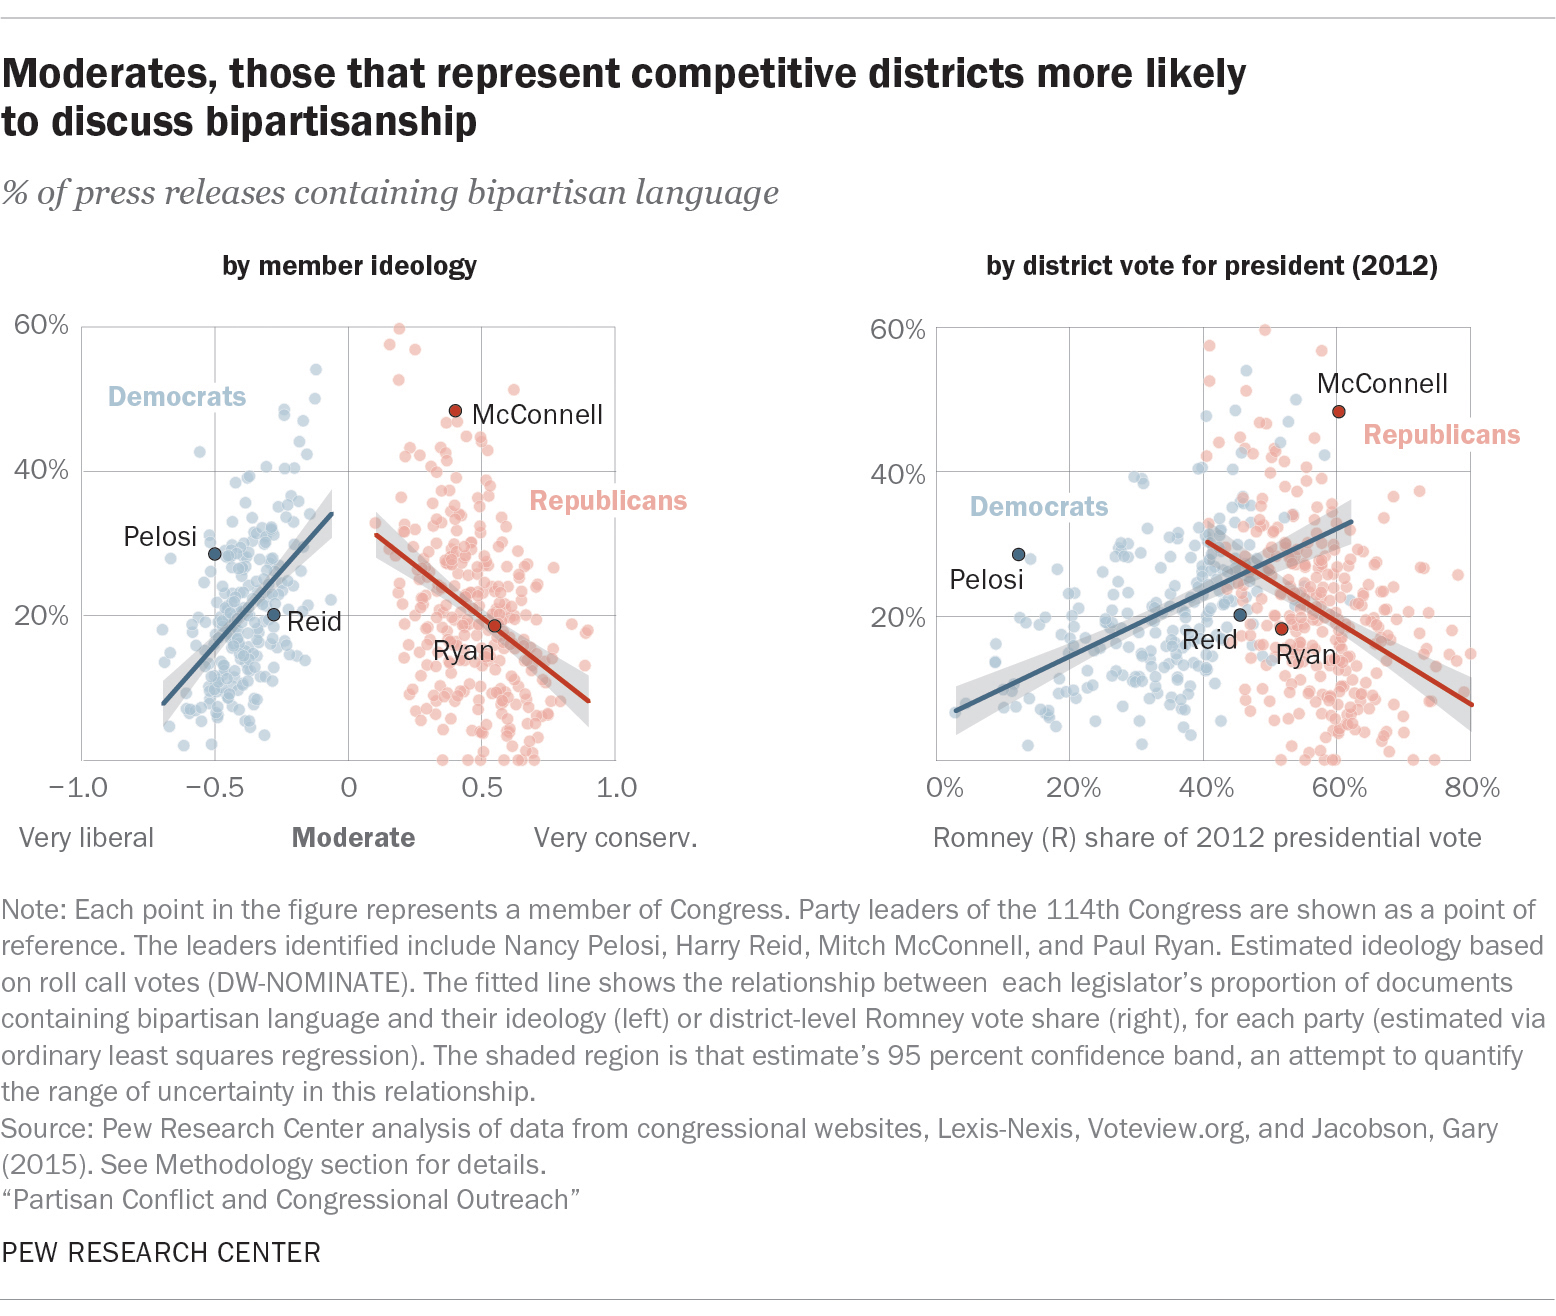
On the other hand, members also discussed legislative bipartisanship – emphasizing the importance of working across the aisle – in 21% of press releases, more than three times as often as on Facebook, where just 6% of posts contained bipartisan content, on average. The most moderate legislators and those in districts with the most partisan competition were the most likely to emphasize bipartisanship. During the period under study here, Facebook posts focused on bipartisanship averaged substantially less engagement than those containing disagreement.
The findings come at a time when many Americans are struggling to make sense of the extreme partisanship and polarization on display in Washington. Some scholarly evidence suggests that in recent years, a decades-long trend toward increasing partisanship in Congress may be influencing the growth of similar divisions among the American public, though it’s difficult to nail down exactly why the public has become more polarized.4
As of 2016, a Pew Research Center study found that more than half of Americans who identify as Republicans or Democrats had a “very unfavorable” view of the opposing party, up from around 20% in the early 1990s. And a 2014 report found that “Republicans and Democrats are more divided along ideological lines – and partisan antipathy is deeper and more extensive – than at any point in the last two decades.”
At the same time, the number of moderates in Congress has dwindled since the 1970s. Yet, in 2014, 56% of Americans said that they preferred leaders who compromise over those who stick to their positions. In 2015, 57% reported feeling frustrated with the federal government. The result is a paradox in American politics: Voters generally say they want a functioning government with legislators willing to compromise, but polarization in Congress – and partisan antipathy among members of the public – continues to rise.
The results presented here come from an analysis of more than a year’s worth of press releases and Facebook posts by members of Congress. While these channels don’t cover all the ways representatives communicate with their constituents – there are also town halls, media appearances, other social media outlets and plenty of discussion on the floors of the House and Senate – they represent two key channels for officials that can be captured and studied in their entirety.5 Studying Facebook posts also makes it possible to measure how much a member’s audience interacts with the posts by looking at likes, comments and shares.
To generate these findings, Pew Research Center used a combination of human coders and machine-learning methods to classify 94,521 press releases and 108,235 Facebook posts issued by members of Congress based on their substantive content: the events, topics and issues raised and discussed in each kind of document. The documents were classified as expressing disagreement; “indignant disagreement,” a type of disagreement that also expresses anger, resentment or annoyance; support for bipartisanship; or descriptions of constituent benefits.
Using machine-learning methods to sort through large amounts of written material has a key advantage: once trained, a computer can look through much more data far more quickly than a team of humans. This type of analysis – still relatively new to the Center – is in its infancy in terms of potential uses for answering key questions in social science, and is full of promise.
At the same time, using computers to code written language is inherently an error-filled process. Because of the complexity of the assigned task (attempting to identify nuanced themes such as “bipartisanship” and “indignation”) and the inevitable possibility of human error associated with the training process, a machine-learning system will miss instances it should have caught, and incorrectly classify some others. Just as survey results need to be understood in the context of a margin of sampling error, there is a degree of error associated with the results presented here. In the cases where this is quantifiable, it is laid out in the methodology at the end of the report.
The period under study in this report spans the beginning of the 114th Congressional session in January 2015 through April 30, 2016, prior to either party’s presidential nominating convention. It also incorporates information about legislators and legislative districts compiled from outside sources. In particular, this report uses a measure called “DW-NOMINATE,” which compares a given legislator’s voting record to every other lawmakers’ to estimate their ideology: where they fall on the liberal to conservative spectrum.
While this analysis is based on a particular time period within a particular Congress, and thus is by definition a snapshot in time, it serves as an exploratory effort on behalf of Pew Research Center to use machine learning to quantify some of the ways that members of Congress communicate with the modern American public in official outreach efforts.
Other important findings
In the 114th Congress, Republicans – as the party that controlled the legislative branch but not the White House – criticized President Barack Obama in their press releases and Facebook posts more often than they criticized other Democrats. Indeed, the average Republican member directed indignant disagreement at the president in 15% of press releases, compared with just 2% that attacked other Democrats. Democratic members, for their part, took an emotionally charged stance against Republicans in 4% of their press releases.
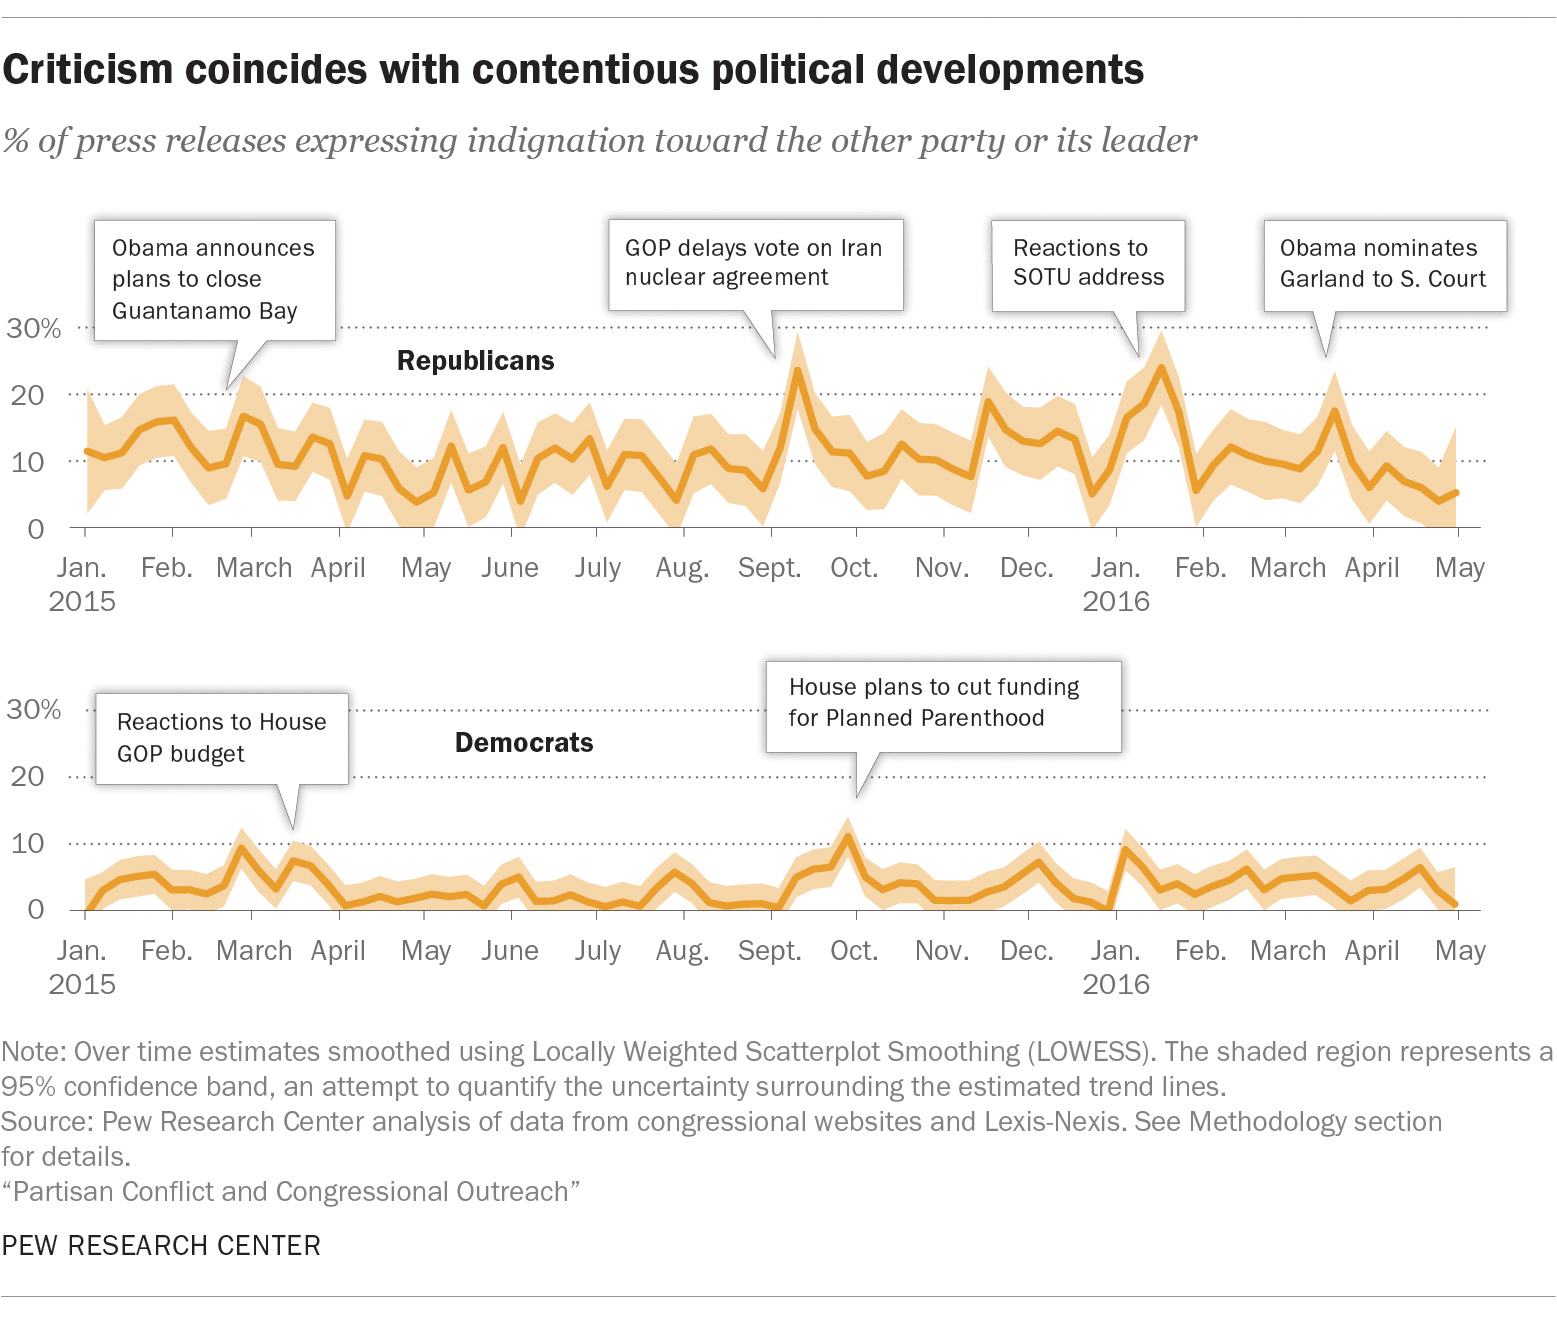
Partisan disagreement often comes in bursts, which appear to follow partisan policy conflicts. In the 114th Congress, strong Democratic opposition to Republicans in press releases followed events such as the GOP’s March 2015 budget proposal and September 2015 plans to defund Planned Parenthood. On the other side of the aisle, Republican opposition to the president and his party surfaced after Obama announced initiatives to sign a nuclear nonproliferation treaty with Iran in August and September 2015; prepared to close the Guantanamo Bay detention center in February 2015; and nominated Merrick Garland to the Supreme Court in March 2016.

On the other hand, Democrats and Republicans issued bipartisan press releases at about the same rate. Bipartisan language appeared in about 21% of press releases for members of both parties. However, the average member of Congress discussed bipartisanship in just 6% of Facebook posts, again with only modest differences between members of the two major parties.
This difference is especially noteworthy in light of the fact that among Americans who pay attention to government and politics on Facebook, those who hold consistently liberal or conservative policy preferences are more likely to follow politicians. Additionally, Americans with consistently liberal or conservative policy preferences are less willing to support compromise in Washington.
