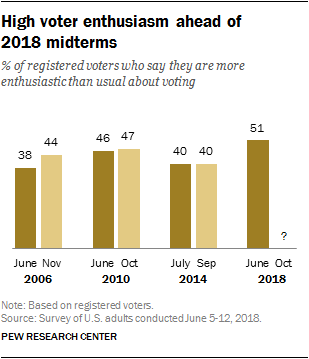
Less than five months before the 2018 midterm elections, about half of registered voters (51%) say they are more enthusiastic about voting compared with previous congressional elections. About a third (34%) say they are less enthusiastic than usual, while 13% volunteer that their enthusiasm is about the same as in the past.
The share of voters saying they are more enthusiastic than usual is at its highest level dating back to 2006. At about the same point in 2010, 46% of voters said they were more enthusiastic about voting than usual. In 2014 and 2006, 40% and 38%, respectively, expressed greater enthusiasm than usual about voting in congressional elections.
In the past, voters’ enthusiasm about voting did not change much between the summer and fall of midterm years. Today, a greater share of voters say they are more enthusiastic about voting than did so in the closing weeks of the three previous midterms.
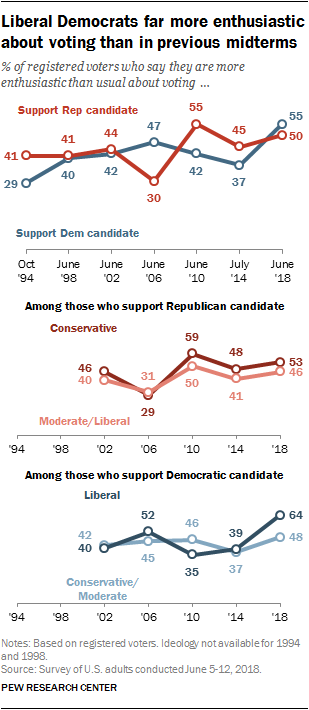
Democrats hold a slight edge in voter enthusiasm: 55% of registered voters who plan to support the Democrat in their district say they are more enthusiastic about voting than usual, and 50% of registered voters who plan to back the Republican say the same.
The share of Democratic voters who say they are more enthusiastic than usual about voting is much higher than it was at about this point in 2014 (37%) or 2010 (42%).
Enthusiasm for voting among GOP voters is about on par with similar points during the 2010 (55% more enthusiastic) and 2014 (45%) midterms.
Among voters who support the Democratic candidate, liberals are especially enthusiastic: 64% say they are more enthusiastic about voting than usual, higher than in the four previous midterms. About half (48%) of moderate and conservative Democratic voters express greater enthusiasm, which is higher than in 2010 but about the same as the share saying this in other midterms since 2002.
Among voters who back the Republican candidate in their district, divides by ideology are more modest: 53% of conservatives say they are more enthusiastic than usual about voting, compared with 46% of moderates and liberals.
Similar shares in both parties are closely following campaign news
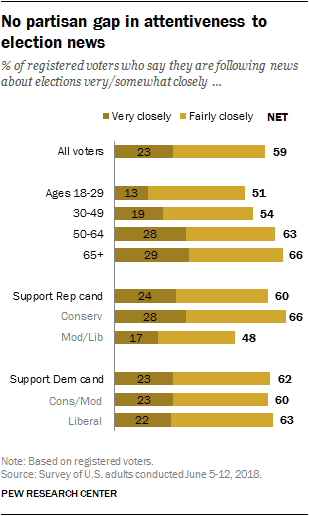
Overall, about six-in-ten registered voters (59%) say they are following news about elections and campaigns in their state and district very or somewhat closely. This is little changed from May, when 57% said they were following election news at least somewhat closely.
Republican voters are just as likely as Democratic voters to say they are following election news closely, but this masks ideological differences among these GOP voters. Two-thirds (67%) of conservative GOP voters say they follow news about elections and campaigns at least somewhat closely; only half of moderate and liberal Republican voters say the same. There is no ideology gap in attention among Democratic voters.
Older voters report following election news more closely than younger voters. About half of registered voters ages 18 to 29 (51%) say they are following election news very or somewhat closely; a similar share of voters ages 30 to 49 (54%) says the same. However, about two-thirds voters ages 50 to 64 (63%) and 65 and older (66%) say they are following the elections very or somewhat closely.
Control of Congress grows in importance as a voting issue
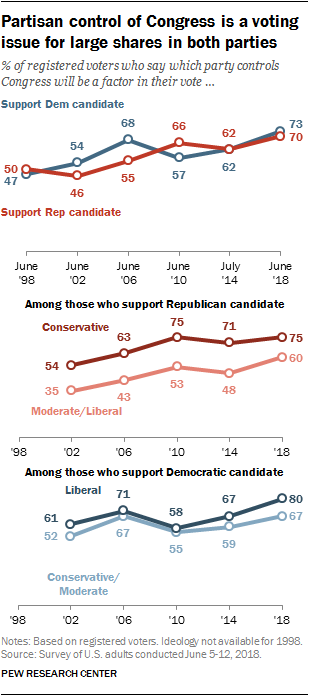
A large majority of registered voters (68%) say that which party controls Congress will be a factor in their vote this year. The share of voters who say partisan control of Congress matters for their vote is at the highest point in any midterm dating to 1998.
Comparable shares of registered voters who favor the Democratic candidate (73%) and the Republican candidate (70%) say the issue of which party controls Congress will be a factor in their vote. For both groups, the share who say they are thinking about party control in their midterm vote is as high as it has been in midterm elections dating to at least 1998.
While large majorities of voters backing both parties’ candidates say congressional control will matter for their vote this year, there are ideological differences within each party. Among those backing Democratic candidates, more liberals (80%) than moderates and conservatives (67%) say the issue of which party controls Congress is a factor in their vote. Similarly, among Republican candidate supporters, conservatives (75%) are more likely than moderates and liberals (60%) to say this.
Race, gender, age, education differences in midterm vote
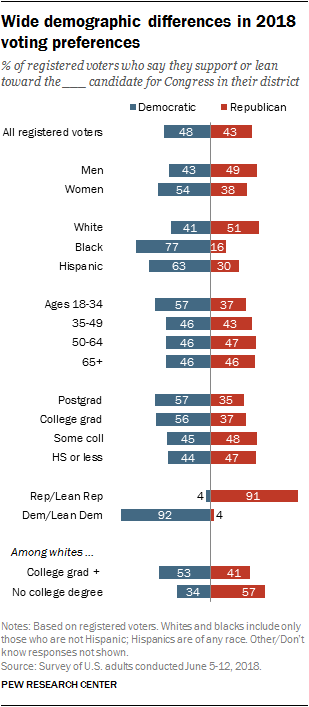
At this stage of the midterm elections cycle, Democrats hold an edge in voting intentions. Nearly half of registered voters (48%) say, if the election were held today, they would support the Democratic candidate, or lean Democratic, while 43% plan to support the Republican Party’s candidate.
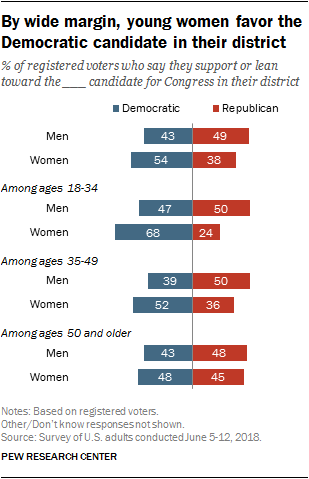
There are stark demographic differences in preferences on the generic ballot for Congress. By 54% to 38%, women say they plan to back the Democratic candidate in their district over the Republican candidate. By contrast, 49% of men plan to support the GOP candidate, compared with 43% who back the Democratic Party’s nominee.
The Democratic Party has wide advantages over the GOP among black (77%-16%) and Hispanic (63%-30%) voters. Whites express more support for the Republican: About half (51%) favor the Republican in their district, while 41% say they plan to support the Democrat.
Young adults ages 18 to 34 are more likely to say they plan to support the Democratic (57%) than Republican (37%) candidate in their district. Older voters are about evenly divided in their midterm preferences.
A majority of postgraduates (57%) and college graduates (56%) say they plan to vote for the Democratic candidate for Congress in their district. Voters with some college experience or no college experience are about as likely to say they will vote Republican as Democratic.
There also is a stark educational divide in preferences among white voters. By 53% to 41%, whites with a college degree favor the Democratic candidate in their district. By contrast, whites without a college degree back the Republican candidate 57% to 34%.
Young women stand out for their strong Democratic midterm preferences. Nearly seven-in-ten (68%) women ages 18 to 34 say they plan to support the Democratic candidate for Congress in their district; just 24% say they plan to back the Republican candidate.
The gender gap among older adults is more modest. For example, 45% of women ages 50 and older say they plan to support the Republican candidate in their district; roughly the same share of men 50 and older say the same (48%).
Most say Trump will be a factor in their congressional vote
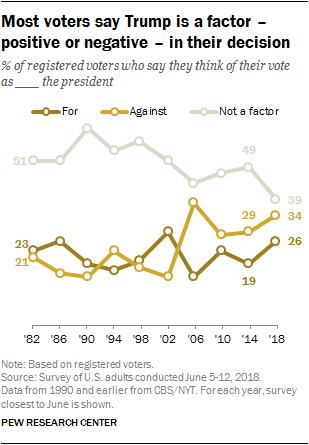
Trump is a bigger factor in midterm voting preferences – positive or negative – than any president in more than three decades. About a third (34%) say they consider their vote for Congress as a vote against Donald Trump, while 26% consider their ballot as a vote for the president. Fewer than half (39%) say that Trump is not much of a factor in their vote.
At about this point in 2010, nearly half of voters (47%) said their view of Barack Obama would not be a factor in their vote; among those who said their view of Obama would matter, slightly more said they considered their vote as a vote against Obama (28%) than for him (23%).
And in 2014, 49% said their view of Obama would not be a factor; among the remainder, more considered their midterm vote as being against Obama (29%) than for him (19%).
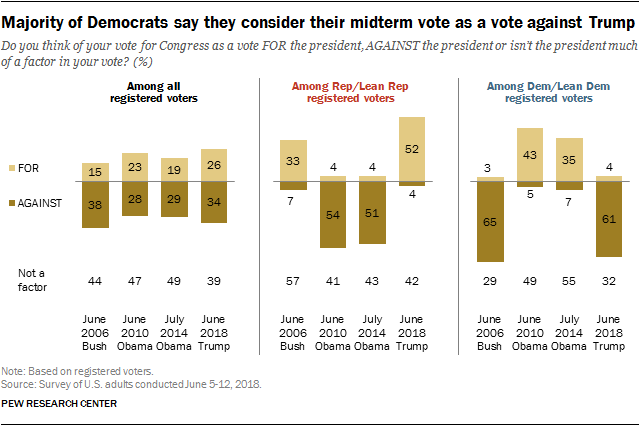
Democrats broadly view their midterm vote as a vote against the president. Overall, 61% of Democratic and Democratic-leaning registered voters say they consider their vote for Congress to be a vote against Trump; a much smaller share (32%) says Trump is not much of a factor in their vote. Democratic opposition to Trump in their midterm vote is somewhat higher than Republican opposition to Obama eight years ago. In June 2010, 54% of Republicans said they considered their vote as a vote against Obama, while 41% said he was not a factor.
The share of Democrats who say they are voting “against” the president in the midterm is comparable to the share who said this in 2006, during George W. Bush’s second term. In June 2006, 65% of Democrats said they considered their midterm ballot as a vote against Bush.
Among Republican and Republican-leaning registered voters, 52% say they think of their vote for Congress as a vote for Trump, while 42% say he isn’t much of a factor. In the summer of 2010 and 2014, smaller shares of Democrats said their vote was for Obama (43% and 30%, respectively). And the share of Republicans who think of their midterm vote as a vote for Trump is much higher than in 2006, when just 33% of Republicans thought of their congressional vote as a vote for Bush.
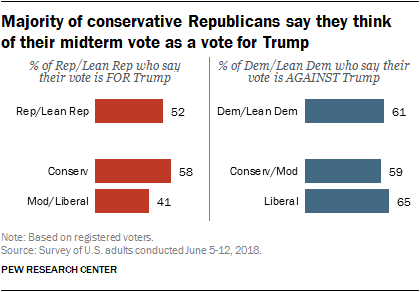
Among Republicans and Republican leaners, nearly six-in-ten conservatives (58%) think of their congressional vote as a vote for Trump. Moderate and liberal Republicans are somewhat less likely to say this: 41% consider their midterm vote to be for Trump.
Among Democrats there is a more modest gap in views by ideology: Majorities of both liberals (65%) and conservatives and moderates (59%) say they consider their vote for Congress as a vote against Trump.
High anti-incumbent sentiment among voters

About two-thirds of registered voters (65%) say they do not want to see most members of Congress re-elected, which is down slightly from a similar point in 2014 (69% in July 2014) but higher than in 2010 (56%). As has been the case since 1994, fewer voters say they would not like to see their own representative re-elected (38%).
A larger share of Democratic voters (40%) than Republican voters (33%) say they would not like their own representative to be returned to Congress in this year’s elections. There was not a partisan gap in anti-incumbent feeling regarding their own representatives in 2014, but Republicans voters (44%) were far more anti-incumbent than Democrats (22%) in 2010. The 2006 cycle was the last time Democratic voters (39%) were more likely than Republican voters (22%) to not want to see their own representative re-elected.
For the first time since 2006, registered voters who plan to vote for the Democratic Party’s candidate in their district this fall (74%) are more likely than those who plan to vote Republican (54%) to say that they do not want to see most members of Congress re-elected. Anti-incumbent sentiment among Democratic voters is up from a similar point in 2014 (when 67% said this). The share of GOP voters saying this (54%) is down 18 percentage points compared with summer 2014 (72%).
Many voters want candidates to discuss immigration and health care
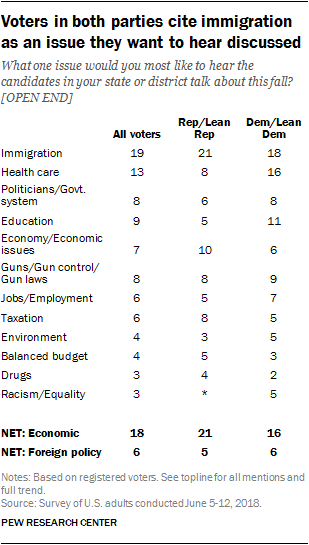
When asked about the issues they would most like to hear discussed in the congressional campaigns, voters were as likely to mention immigration issues as they were to want to hear about any other economic issue. About one-in-five (19%) mentioned immigration. Overall, 18% of voters mentioned some economic issue as what they wanted to hear discussed in the congressional campaigns.
Substantial shares of registered voters also wanted to hear about health care (13%), education (9%), guns and gun issues (8%), specific politicians or the government system (8%) and the economy (7%).
Overall, Republican and Republican-leaning voters’ answers were more varied to this question. The only thing that Republican voters mentioned at higher rates than Democratic voters was the border wall. Overall, 4% of Republican voters mentioned the border wall. Fewer than 1% of Democratic voters mentioned it.
Democrats and Democratic-leaning voters were at least twice as likely as Republicans to mention health care (16% vs. 8%), education (11% vs 4%) and racial issues (5% vs. less than 1%).
Majority says outcome of 2018 election is ‘very important’

About two-thirds of Americans (65%) view the outcome of the 2018 congressional elections as a very important issue for the country. And while this view is widely shared in both parties, Democrats are somewhat more likely to say this than Republicans (70% vs. 62%).
There are wider partisan divides over the importance of some other issues, including the investigation into alleged Russian involvement in the 2016 election. Nearly two-thirds (64%) of Democrats and Democratic leaners say this investigation is “very important” for the country, but just 18% of Republicans and Republican leaners say the same (views on this issue are broadly similar to those measured in December 2017).
Democrats also are more likely than Republicans to view the issues of sexual assault and harassment (80% vs. 55%) and the status of immigrants who came to the country illegally when they were children (59% vs. 46%) as very important to the country.
By contrast, somewhat more Republicans (75%) than Democrats (63%) say the negotiations with North Korea over its nuclear program are very important. (Note: Most of the survey was fielded before the June 12 summit between Trump and North Korean leader Kim Jong Un.)
Voters have concerns about how 116th Congress – led by Republicans or Democrats – would deal with Trump administration
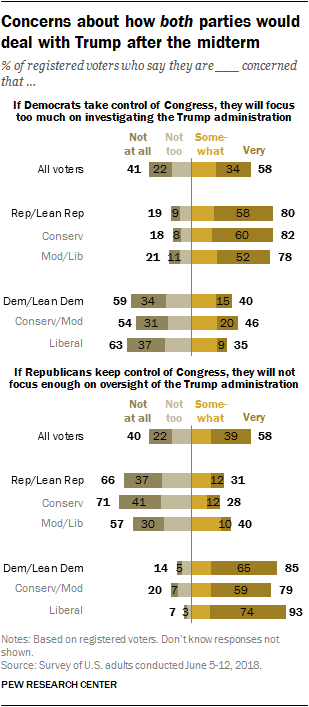
The majority of voters are concerned that – regardless of who is in control after this fall’s elections – Congress will not strike the right balance in its relationship with the Trump administration.
Nearly six-in-ten voters (58%) are very or somewhat concerned that if Democrats take control of Congress this fall they will focus too much on investigating the Trump administration.
An equal share (58%) is concerned that Republicans will not focus enough on oversight of the Trump administration if they keep control of Congress.
Partisans express great concern about how the other side would handle its relationship with the Trump administration, but they are less concerned about their own party’s approach.
A large majority of Republican and Republican-leaning registered voters (80%) say they are very or somewhat concerned that if Democrats win control of Congress, they will focus too much on investigating the administration. If the GOP retains control, far fewer Republicans say they are concerned the party will not provide enough oversight of Trump (though 31% say they are at least somewhat concerned about this).
Likewise, a large majority of Democrats and Democratic leaners (85%) are concerned that Republicans would not focus enough on oversight if they retain their majorities. Four-in-ten (40%) say they would be concerned about a Democratic-led Congress going too far investigating the Trump administration.