To analyze the content of congressional Facebook posts, researchers studied a complete set of posts created by members of the U.S. Senate and House of Representatives and displayed on their official and unofficial public pages between Jan. 1, 2015, and Dec. 31, 2017. Data from previous Congresses were not available. Researchers used the Facebook Graph API to download the posts from members’ public pages. Next, they classified the content of the posts using a combination of expert coding, crowd-sourcing and machine learning. Once the posts were classified, researchers used regression analysis to evaluate the relationship between particular posts and the level of engagement Facebook users had with each type of post.
Data for this report came from three sources:
- Facebook posts collected directly from legislators’ public pages through Facebook Graph Application Programming Interface (API)
- Human coding of Facebook posts completed by Amazon Mechanical Turk workers and researchers within Pew Research Center.
- Existing measures of congressional ideology based on roll-call voting.
Random effects regression is a type of statistical model used here to estimate the relationship between particular kinds of posts and the amount of engagement those posts received. This model is appropriate for the structure of the collected Facebook data – a large number of posts that are associated with a smaller number of legislators – and adjusts for the fact that some legislators have much larger online audiences than others.
DW-NOMINATE is a measure of political ideology that places members of the U.S. House and Senate on a liberal-to-conservative ideology scale according to their roll-call voting history in each legislative session of Congress.1 The scale ranges from -1 (very liberal) to 1 (very conservative) across all Congresses. For the time period studied here it ranges between -0.77 and 0.99. Very liberal and very conservative legislators are defined as those with DW-NOMINATE scores in the furthest left 10% and furthest right 10% of all DW-NOMINATE scores. Moderates are defined as legislators with DW-NOMINATE scores in the middle 20% of all scores.
Data collection
The first step in the analysis was to identify each member’s Facebook pages. Many members of Congress maintain multiple social media accounts, consisting of one or more “official,” campaign or personal accounts. Official accounts are used to communicate information as part of the member’s representational or legislative capacity, and U.S. Senate and House members may draw upon official staff resources appropriated by Congress when releasing content via these accounts. Personal and campaign accounts may not draw on these government resources under official House and Senate guidelines.
Researchers started with an existing dataset of official and unofficial accounts for members of the 114th Congress and expanded it with data on members of the 115th Congress from the open-source @unitedstates project. Official accounts are managed by congressional staff and used for official legislative business, while unofficial Facebook accounts are used in a personal or campaign capacity. Researchers also manually checked for additional accounts by reviewing the House and Senate pages of members who were not found in the initial dataset. Every account was then manually reviewed and verified.
The research team first examined each account’s Facebook page and confirmed that it was associated with the correct politician. All misattributions were manually corrected by Center experts, resulting in a list of 1,129 total Facebook accounts. Accounts were then classified as official or unofficial based on the links to and from their official “.gov’’ pages. Accounts were considered official if they were referenced by a member’s official house.gov or senate.gov homepage. Congressional rules prohibit linking between official (.gov) and campaign websites or accounts, as well as linking from an official site or account to a personal site or account.
In cases where it was not clear that a Facebook page had ever been used in an official capacity (particularly for members that are no longer in Congress with active webpages), the most recent historical copy of the member’s official webpage was manually reviewed using the Library of Congress online archive to determine if a link to the account had been present when the webpage was active. The resulting list of all official accounts for members of the 114th and 115th Congresses was then used to collect the Facebook posts published by each page between Jan. 1, 2015, and Dec. 31, 2017.
Using the Facebook Graph API, researchers obtained Facebook posts for members of the 114th Congress (2015-2016) between Dec. 30 and 31, 2016, so that members who left office before the 115th Congress began would be included in the sample. Between Jan. 2 and Jan. 6, 2018, researchers obtained posts for members of the 115th Congress (2017-2018).
After obtaining posts, researchers checked the combined dataset and identified a small number of duplicate posts from members of Congress who served in both the 114th and 115th Congresses. The duplicates had been introduced due to changes in the public pages’ unique Facebook API identifiers, resulting in mismatches between the latest copy of certain posts and older copies that had previously been collected. These duplicates frequently occurred on posts that had been edited or modified slightly – often with nearly identical time stamps and only single character variations (e.g., deleting a space). The unique identifiers of these duplicates were also very similar themselves, differing by only a few digits in specific locations of the identifier string. In all of these cases, the posts’ time stamps were rarely separated by more than a few minutes, and were always within 24 hours of each other.
An additional set of duplicates was also found among posts that were produced by pages that had changed names at some point during the time frame. These posts most frequently occurred after the end of election season, when a number of politicians change the titles of their Facebook pages – removing suffixes such as “for Congress” or adding honorifics like “Senator” to their name. In these cases, the time stamps and content of the posts were perfectly identical but the prefixes of the posts’ unique identifiers were different.
There were several patterns across multiple post fields that appeared to distinguish duplicates from unique posts. However, no clear set of rules could be identified that comprehensively explained these patterns, so researchers employed a machine learning approach to isolate and remove the duplicate posts.
First, researchers scanned the entire set of posts for each account using a sliding window of two days and identified all pairs of potential duplicates within each window that matched either of the following criteria:
- Identical time stamps
- TF-IDF cosine similarity of 0.6 or above, and a Levenshtein difference ratio of 60% or higher on the text of the post
From these “candidate duplicates,” a random sample of 1,000 pairs was extracted and manually reviewed. Researchers identified whether or not the two posts in each candidate pair were in fact duplicates. Only 24% were determined to be true duplicates. These results were then used to train a machine learning algorithm using 750 of the pairs to train the model and 250 to evaluate its performance. Researchers trained a random forest machine learning model using a variety of features – or model inputs – representing the similarity of the two posts across different fields and interactions between these features. The features that best identified duplicates included whether the two posts shared an identical time stamp, the number of digits that overlapped between the posts’ ID numbers and the difference between the posts’ time stamps in seconds. The resulting model achieved high performance, with an average precision and recall of 98%. Of the 250 potential duplicate pairs used to evaluate the model, it missed only four duplicates and correctly classified the remaining 246.
The model was then applied to the entire collection of potential duplicates, removing duplicates when detected. In total, 30,508 posts (4% of the original dataset) were identified as duplicates and excluded before the analysis began.
The final dataset included only those posts that were produced by a member’s primary official and/or unofficial Facebook accounts during the time in which they were serving a term as a representative or senator in Congress. The resulting dataset contains 737,598 Facebook posts from 599 different members of Congress who used a total of 1,129 official and unofficial accounts. Photo and video posts were included in this analysis. The findings presented in this report exclude posts by nonvoting representatives, and only posts produced by members that were active online in a given Congress, defined as members that produced at least 10 Facebook posts during each Congress. Members that meet this threshold for just one of the Congresses are only included for that specific Congress.
Content coding
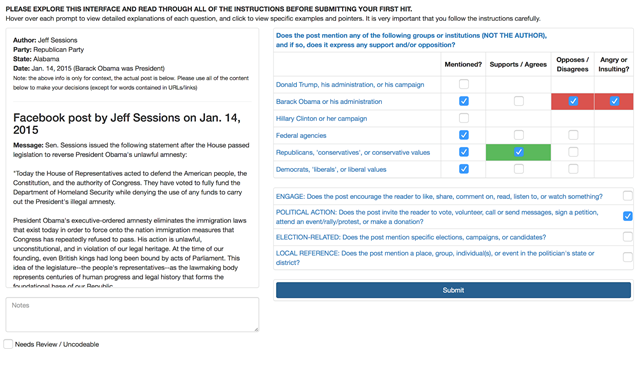
Researchers created an online content classification interface to label the Facebook posts. This interface included the time the post was created, its author, the party of its author, an indication of who was president when the post was created, and all links and captions associated with the post. Content coders were instructed to indicate whether the post mentioned Donald Trump, Barack Obama, Hillary Clinton, federal agencies, Democrats and/or Republicans. If the post did mention any of these entities, coders could select whether the post expressed support/agreement with them, opposition/disagreement with them, or if it was angry/insulting toward them. Finally, coders were instructed to note whether the post asked the reader to engage in political actions, whether the post was election related, or whether the post concerned a specific local event, institution, organization or individual.
Detailed instructions were provided for each of these items (note that not all items are used in this analysis); these instructions appear in Appendix A. An example of the content classification window appears below:
Extracting samples
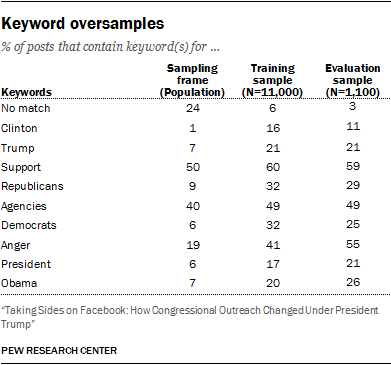
Researchers extracted two samples of the Facebook posts for coding: one large sample of 11,000 posts to be classified by workers on Amazon Mechanical Turk, and a smaller sample of 1,100 posts for internal evaluation. In order to ensure that researchers examined enough posts that contained expressions of opposition or support, researchers drew samples of Facebook posts using keyword oversampling. Building on previous research that also used this approach, a series of regular expressions were used to disproportionately select posts that contained keywords likely to co-occur with expressions of political opposition or support. The patterns used appear in Appendix B.
Subsequent analysis adjusted for this process by using probability weights computed by comparing all of the keyword combination strata against the full population. The final proportion of posts containing a keyword in each set are reported below (some posts match multiple keyword sets; proportions are not mutually exclusive).
The samples were extracted in two phases. Initially, an evaluation sample of 650 posts was extracted from a sampling frame of 447,675 Facebook posts created by members’ official Facebook accounts between Jan. 1, 2015 and July 20, 2017. These were coded by multiple in-house experts to establish a baseline of interrater reliability, and also coded each by five different Mechanical Turk users, to be compared against the in-house baseline. A larger sample of 6,499 different posts was extracted from the frame and coded only by Mechanical Turk users to serve as training data for the machine learning classifiers. Mechanical Turk workers completed these assignments in the fall of 2017.
After researchers determined that they had reliably identified all of the unofficial Facebook accounts for members of Congress and determined that nearly every member had both an official and unofficial account, the scope of the sampling frame was expanded to include unofficial posts, increasing its size by 40%. The sampling frame was then also extended to encompass a wider time frame, including three full years (from the beginning of 2015 through the end of 2017). Expanding the time frame increased the post count by an additional 17%. The final population consisted of 737,598 posts – 65% larger than the original dataset. As a result, the training and evaluation samples were expanded in a proportional fashion. To do so, new rows were added to the existing samples by drawing exclusively from posts from the new accounts that were created during the original time frame, increasing the sample sizes up by 40%. These new rows were drawn using post-stratification weights based on the party of the member, whether the account was official or not, and the month during which the post was made. These weights ensured that the resulting sample preserved representative proportions across those dimensions. The newly added posts were nearly all unofficial posts, although a handful of the additional posts were drawn from several new official accounts that had been created since the initial sample was drawn, due to special elections.
The process of adding additional posts was divided into 10 different iterative steps in order to accurately represent the characteristics of the population data. Prior to each step, researchers computed post-stratification weights using the aforementioned post characteristics and then multiplied by weights based on the original sample’s keyword oversampling proportions in order to preserve the oversampling rates at which new posts would be added. One-tenth of the desired number of new posts was then sampled using these weights, after which the weights were recomputed. Through this iterative process, the weights were adjusted to compensate for random variation, allowing the sample to smoothly converge to the correct population proportions in each stratum as it approached its target size.
Finally, the newly expanded samples were expanded once more using this same process, this time increasing their size 17% to proportionally match the expansion of the time frame. These new rows were drawn exclusively from both official and unofficial posts produced after the time frame of the initial sample and were again extracted using post-stratification weights on month, official account status and political party. Finally, to round the sample sizes up to an even number, a small number of additional rows were drawn from the entire final sampling frame using the post-stratification weights, bringing the evaluation sample to 1,100 posts, up from 650, and the training sample to 11,000 posts, up from 6,499. The new posts were then coded by in-house experts and Mechanical Turk users in early 2018.
Every post in the training and evaluation samples was coded by five different Mechanical Turk users, and every post in the evaluation sample was also coded by in-house experts. A total of five in-house experts divided up the coding tasks and each post in the evaluation sample was coded by two different coders.
Validating crowd-sourced data
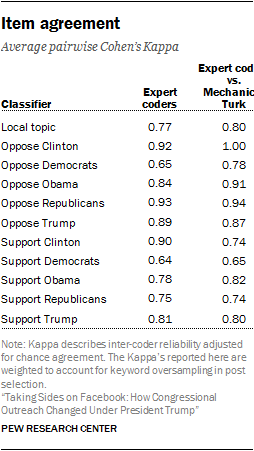
To assess how closely the expert coders agreed on these labeling tasks, researchers computed the average pairwise Cohen’s Kappa, weighted by the number of overlapping tasks each pair of coders completed. To evaluate the crowd-sourced results, the Mechanical Turk results were first collapsed using a 2-out-of-5 threshold that was determined to be effective at maximizing agreement in prior research. Researchers then reviewed all coding disagreements between the expert coders and resolved the disputes, resulting in a single label for each post. These single ground-truth expert labels were then compared against the collapsed crowd-sourced results, using Cohen’s Kappa to compute reliability. The results indicate that the agreement between the collapsed Mechanical Turk labels and those from in-house coders are comparable to the agreement between individual in-house coders.
Content classification
Cleaning the text
To produce a dataset useful for machine learning, the text of each post was converted into a set of features, representing words and phrases. To accomplish this, each post was passed through a series of pre-processing functions. First, to avoid including words that could bias the machine learning models toward particular politicians or districts, a set of custom stopword lists were used to filter out names and other proper nouns, comprised of the following:
- A list of 318 common English stopwords, taken from the Glasgow Information Retrieval Group
- A list of 9,938 first and last names, taken from a Pew Research Center database of 14,289 current and historical politicians and filtered using WordNet
- A list of 896 state names and state identifiers (e.g. “West Virginian”, “Texan”)
- A list of 18,128 city and county names, taken from a Pew Research Center database of geocoded campaign contributions, and filtered using WordNet
- A list of 24 month names and abbreviations
- 377 additional stopwords, manually identified through a process of iterative review by Center researchers
Some people and locations have names that are also common English words, some of which are used far more frequently as the latter. To avoid unnecessarily excluding these words from our training data, potential stopwords were assessed using WordNet, which provides information on a word’s alternative definitions and where they fall on a spectrum of generality to specificity (using a hyponymy taxonomy). Words were flagged as being common and/or versatile enough to be included in the training data and removed from the stopword list if they met two or more of the following criteria:
- The word has more than two different definitions (synsets)
- One or more of the word’s definitions (synsets) had a variation (lemma) with a depth of less than five (indicating generality)
- One or more of the word’s definitions (synsets) had at least two variations (lemmas)
After combining all of these lists into a single set of stopwords, an additional 77 words were removed, based on a list compiled by Center researchers during a process of manual iterative review. This ultimately resulted in a list of 27,413 stopwords that were removed from the text of all posts. After removing stopwords, the text of each post was lowercased and URLs and links were removed using a regular expression.
Common contractions were expanded into their constituent words, punctuation was removed and each sentence was tokenized using the resulting whitespace. Finally, words were lemmatized (reduced to their semantic root form) and filtered to those containing three or more characters.
Extracting features
Machine learning classifiers were trained using a variety of features:
- Term-frequency inverse-document frequency matrices with l2 normalization, containing 1 to 4 grams with a minimum document frequency of 10 and maximum document proportion of 90%
- Term frequency matrices with no normalization, containing 1 to 4 grams with a minimum document frequency of 10 and maximum document proportion of 90%
- Features based on 300 Word2Vec dimensions extracted using a pre-trained model (Google News); the average, maximum, minimum, standard deviation, and median of each vector, aggregated from the words in each post that matched to any of the 500,000 most frequent words in the pre-trained model
For target-specific support and opposition models, an additional set of features were extracted using the relevant target-specific regular expression from the keyword oversampling patterns described earlier, as well as the more general “anger” and “support” regular expressions:
- TF and TF-IDF matrices with the same parameters as 1 and 2 above, extracted from the subset of sentences in each post that contained keywords relevant to the classification variable, identified using the oversampling regular expression relevant to the target being classified
- A set of features based on the “anger” keyword oversampling regular expression: a boolean flag indicating whether a post contained a match, the total number of matches in the post, and the squared and logged values of the total number of matches
- The same set of features in 2, except for the “support” keyword oversampling regular expression
- The same set of features in 2 and 3, except for the “president” keyword oversampling regular expression (Trump/Obama/Clinton models only)
Model training
Researchers used machine learning algorithms to classify the entire set of Facebook posts used in this report based on the training results from human coders. Training data was weighted and evaluated using traditional sample weighting based on the population proportions of oversampled keywords. Additional weights were used only during the model training process (not during evaluation), weighting cases using the inverse proportion of their class. The XGBoost classification algorithm was used for each of the classifiers used in this report.
Researchers trained the algorithms separately for posts authored by Republican members of Congress and those authored by Democratic members. As a result, the models predicted opposition to Trump and Republicans and/or conservatives within the set of posts created by Democrats in Congress, but not for posts created by Republicans. For posts authored by Republicans, the models predicted opposition to Obama, Democrats and/or liberals, and Clinton. Likewise, the models predicted support for Trump and Republicans and/or conservatives within the set of Republican-authored posts, but not posts authored by Democrats, and vice versa. Overall, 46% of the training data and 47% of the test data were used for Democratic post classification models, leaving 54% and 53% of the training and test data for Republican models, respectively. Posts by both Democrats and Republicans in Congress were used together when training and evaluating the local topic mention classification algorithm.
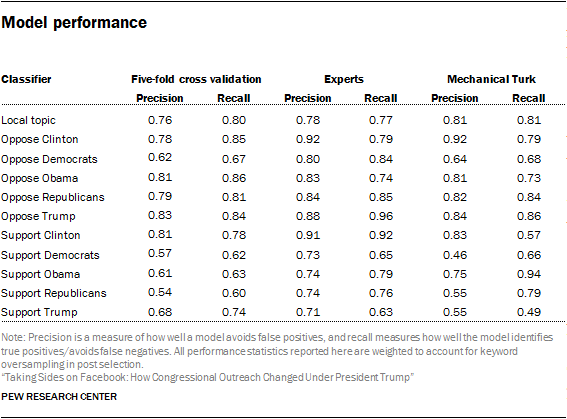
Rather than use the discrete predictions produced by the classifiers, a custom threshold was identified for each model and applied to the raw probabilities of its predictions. To find this threshold, the models were trained on the full training dataset and applied to the evaluation posts. These predictions were compared against the in-house expert codes across full range of possible thresholds (0-1), evaluated based on the precision and recall of the model at each possible cutoff. Next, the model was trained using a five-fold split of the training data, and evaluated on each of the five folds. For each fold, the classifier was again evaluated across the full range of possible thresholds.
This time, the cutoffs were evaluated in terms of the minimum of the precision and recall for that fold unless the precision or recall at that threshold had been lower in the evaluation set, in which case the latter was taken as the score. This resulted in a score at each potential threshold, representing the model’s worst performance at that cutoff across both the held-out fold and the expert evaluation set. The threshold that maximized this score was selected for each fold, and these five thresholds were averaged together to produce a final threshold for the classifier. In effect, this resulted in classifiers that had optimal performance across multiple hold-out folds and the expert evaluation set, and that achieved a balance between precision and recall, ensuring that false positive and false negative rates were as equal as possible.
The following table shows the performance for each model, including the five-fold precision and recall averages and the precision and recall when the hand-coded expert and Mechanical Turk data to the machine learning predictions. In most cases, the machine-learning classifiers agree more closely with in-house experts than they do with the aggregated Mechanical Turk labels.
Evaluating potential machine learning bias
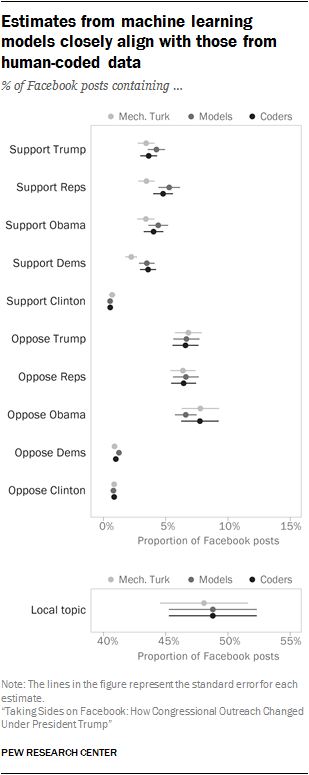
After researchers classified individual posts, they aggregated those classification decisions across members, parties and time periods to arrive at global estimates of the proportion of posts that contained support or opposition directed at the individuals and groups described above. However, this procedure risks producing biased estimates of overall rates if the models used to classify posts systematically over- or under-state the prevalence of particular kinds of posts. To assess this risk, researchers calculated the global proportion of posts containing a positive value for each classification, across the expert coder sample (1,100 posts, all human coded), the Mechanical Turk sample (11,000 posts, all human coded) and the sample of predicted classifications (all remaining posts, machine coded). These estimates are shown above. In all cases, the estimated proportion of posts containing each kind of content is very similar across the three estimation strategies. None of the differences across estimates within each classification type are statistically significant, indicating that the model predictions are unlikely to be biased for the full sample of posts.
Engagement analysis
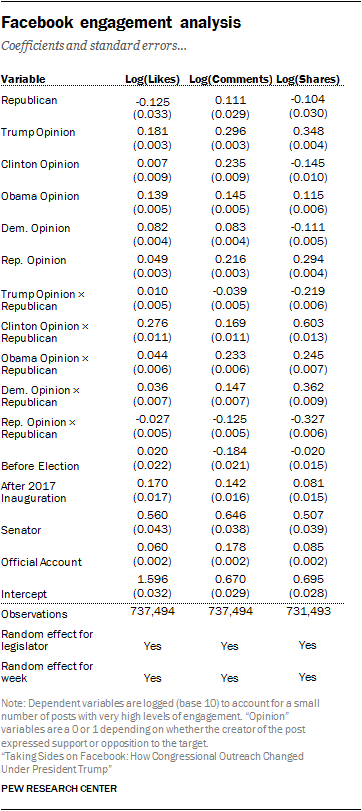
Researchers used multiple regression models in order to estimate the relationship between certain kinds of posts and the rate at which the Facebook audience engaged with those posts. These models are useful because they include terms (random intercepts) that act as baselines for drawing comparisons across different groups (in this case, groups of posts all made by the same member of Congress or groups of posts created during the same week).
Because some members of Congress are particularly likely to both have large numbers of online followers and to post particular kinds of content, researchers used models to help account for the fact that some posts were seen by many more Facebook users than other posts. The models included interaction terms between each “opinion” variable (meaning that the post either supported or opposed the political figure or group attached to that opinion) and the partisanship of the post’s author. For Republicans, the predicted number of likes, comments and shares for each political target was based upon the sum of the predictions from component terms in the interaction model (Republican, opinion of some target and the interaction term that captures both), with all other variables held at their mean. For Democrats in Congress, the Republican term and the interaction terms always had a coefficient of 0, and the predicted number of likes, comments or shares for each political target was based on the coefficients for the opinion variables, alongside the coefficients for all other control variables set to their means.
Researchers estimated percentage increases in likes, comments and shares relative to a post by the average member of Congress that did not express an opinion (supportive or oppositional) about any of the political targets included here. For several thousand posts, the number of shares were not available. These posts are excluded from the shares regression model.