For the most recent data on partisan identification in the U.S., read this April 2024 report: Changing Partisan Coalitions in a Politically Divided Nation
Note that the 2024 report is based on data from online surveys, with historical telephone data adjusted to make trends directly comparable to online surveys. As a result, the historical point estimates in this 2020 report differ from those in the 2024 report. There is nothing inaccurate about this 2020 report. Both reports tell essentially the same story about trends in American voters’ partisanship. Visit Appendix A of the 2024 report for more detail.
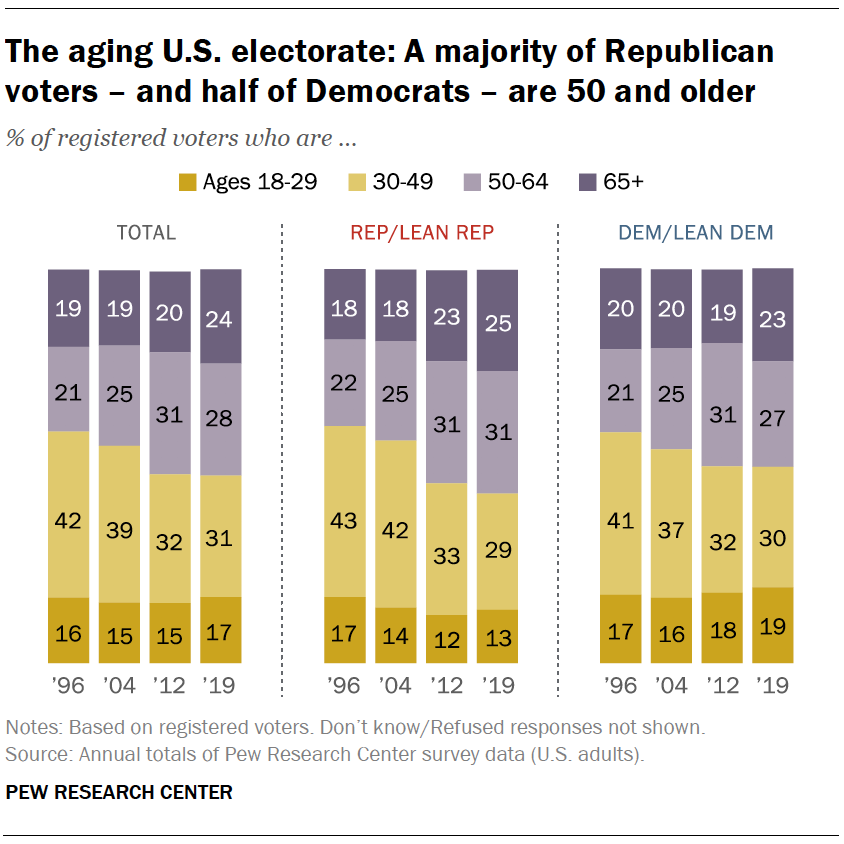
The demographic profile of voters has changed in important ways over the past two decades. Overall, the electorate is getting older, and this is seen more among Republican voters than among Democrats.
In addition, the electorate, like the U.S. population, has become much more racially and ethnically diverse. This shift is reflected much more in the demographic profile of Democratic voters than among Republicans.
A majority of all registered voters (52%) are ages 50 and older. This is little changed from 2012 (51%), though is much higher than in 2004 (44%) or 1996 (41%).
The shares of both parties’ voters who are ages 50 and older have increased over the past two decades.
However, while a majority of Republican and Republican-leaning registered voters are ages 50 and older (56%), a smaller share of Democratic and Democratic-leaning voters are in that age group (50%). In 1996, the age composition of the two parties looked more similar. Roughly four-in-ten voters in both parties were at least 50 years old (41% of Democrats, 39% of Republicans).
Nearly a quarter of voters (24%) are ages 65 and older, up from 20% eight years ago; by comparison, the share of voters who are under age 30 has remained relatively stable (17% currently). Voters who are 65 and older make up larger shares in both parties than do voters under age 30. However, the difference is much larger among Republican voters (25% are 65 and older, while 13% are under 30) than among Democrats (23% and 19%, respectively).
Over the past two decades, the median age of all voters has increased, from 44 in 1996 to 50 in 2019. Among Republicans, the median age has increased by nine years, from 43 to 52, while the median age of Democrats has risen from 45 to 49.
Electorate has become more ethnically diverse, better educated
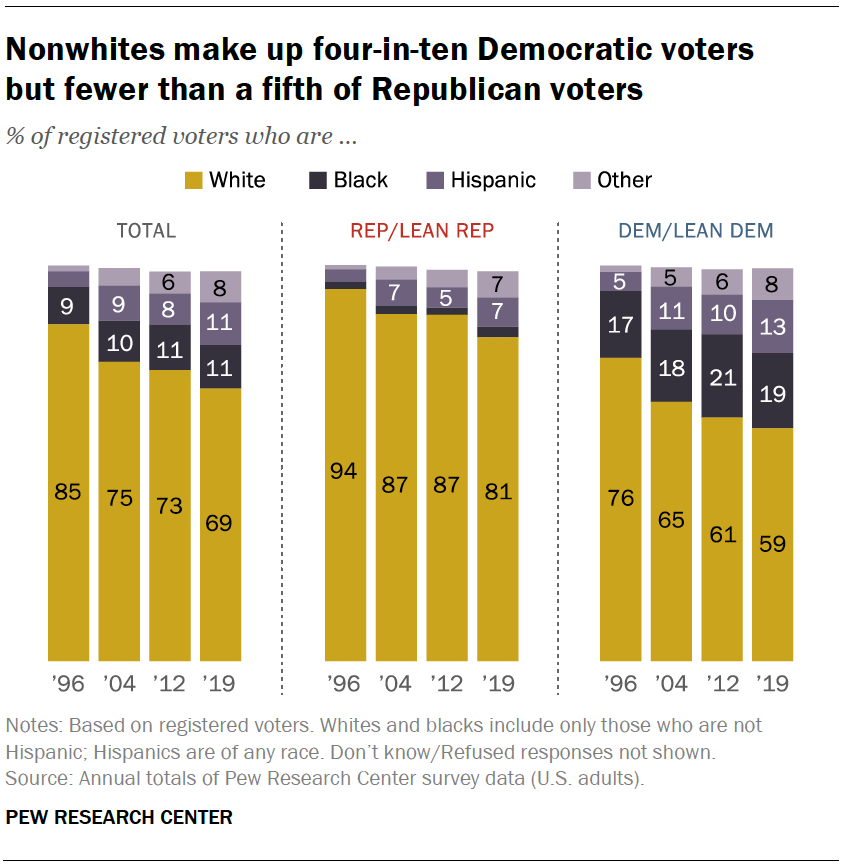
Non-Hispanic white voters make up a steadily decreasing share of the electorate. In 1996, white non-Hispanics constituted an overwhelming majority (85%) of registered voters. Today, 69% of voters are non-Hispanic white. Over this period, the share of voters who are black, Hispanic or another race has risen from 15% to 30%.
Hispanic voters have nearly tripled since 1996 as a share of the electorate, and they make up 11% of all registered voters today, compared with 4% in 1996. Voters who describe their race as “other” have also become a larger share of the electorate, making up 8% of voters today, compared with just 1% of voters in 1996.
Black Americans make up 11% of registered voters, a similar share to 1996, when they were 9% of all registered voters.
The growing racial and ethnic diversity has changed the composition of both parties, but the change has been starker among Democrats.
While white registered voters make up a majority of the Democratic Party, their share has declined. In 1996, white voters constituted 76% of all Democratic and Democratic-leaning voters; today, they make up 59%. Four-in-ten Democratic voters are nonwhite, an increase from nearly one-in-four in 1996.
An overwhelming majority of Republican and Republican-leaning voters continue to be white. Today, whites make up roughly eight-in-ten (81%) Republican voters, down from 94% in 1996. Still, the share of nonwhite voters in the Republican Party has more than doubled in that time (6% in 1996, 17% in 2019).
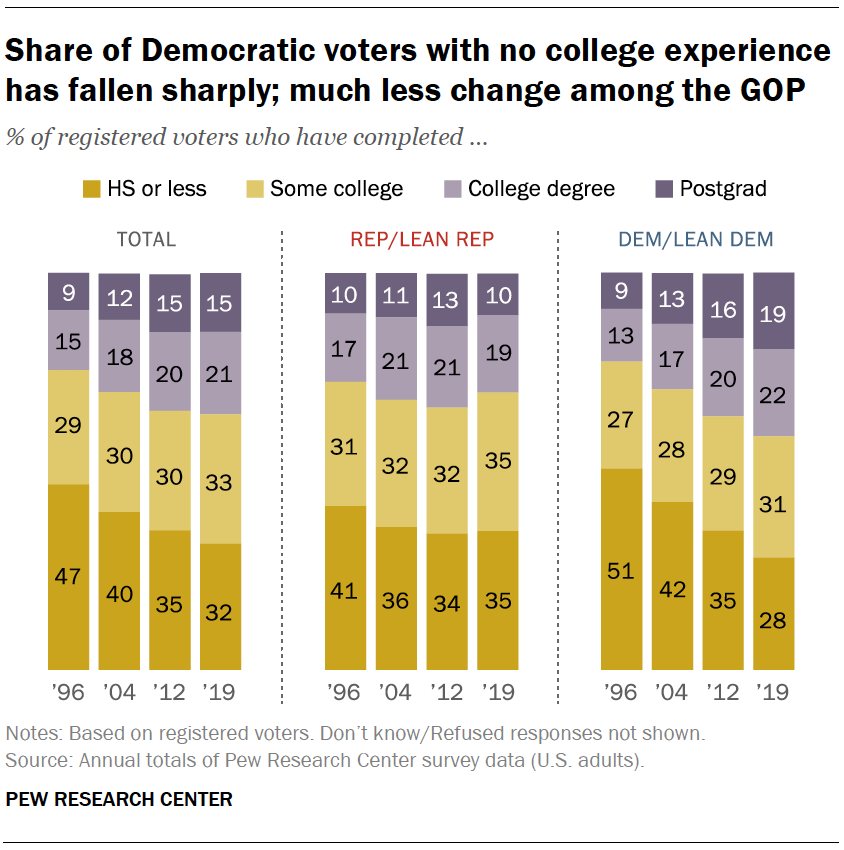
The educational landscape of the U.S. has changed dramatically since 1996, when Bill Clinton was seeking his second term as president.
At that time, nearly half of registered voters (47%) had never attended college; another three-in-ten (29%) had some college experience but no four-year degree, and roughly a quarter (24%) had at least a four-year college degree.
Today, only 32% have never attended college, while another third have some college experience and no degree and 36% have at least a four-year degree.
The educational profile of Democratic voters has changed dramatically since 1996. At that time, voters with no college experience made up about half of Democratic voters (51%); today, just 28% have not attended college. The share of Democratic voters with at least a four-year degree has increased from 22% to 41%.
During the same period, the share of Republican voters with a four-year college degree is mostly unchanged (27% then to 30% today) and is down from 2012, when 34% of Republicans had a four-year college degree.
As a result, college graduates make up a much larger share of Democratic than Republican voters (41% vs. 30%). In 1996, Republican voters were more likely than Democrats to have at least a four-year degree (27% vs. 22%).
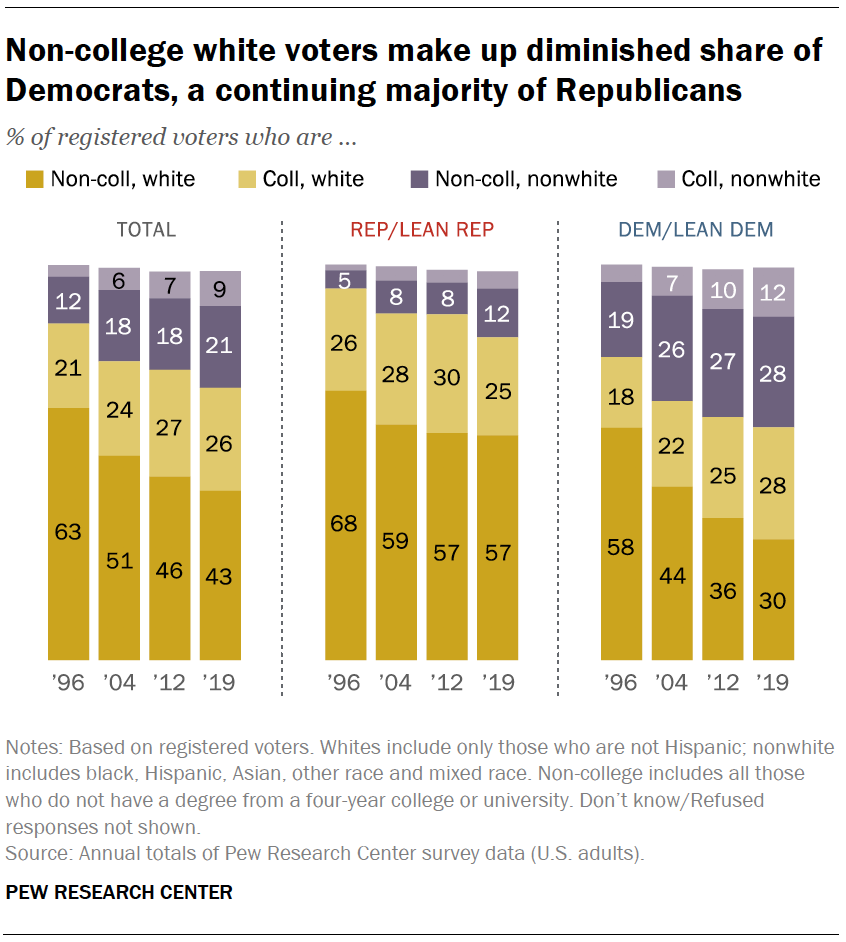
The rise in educational attainment among voters, combined with the growing ethnic diversity of the electorate, has had very different impacts on the Democratic and Republican coalitions.
In 1996, 63% of all registered voters, including majorities of Republicans (68%) and Democrats (58%), were whites who did not have a four-year college degree.
Since then, the share of non-college white voters has declined 20 percentage points. But while this group still constitutes a 57% majority of Republican voters – a share that has changed little since 2004 – non-college whites only make up 30% of Democratic voters.
The Democratic coalition is now a mix of non-college whites, whites with at least a four-year college degree (28%), nonwhites who have not completed college (also 28%) and nonwhites with at least a four-year degree (12%). The largest share of Republican voters are non-college whites (57%), followed by whites with a college degree (25%), nonwhites who do not have a degree (12%) and those who have completed college (4%).
Fewer voters identify as Christians as share who are religiously unaffiliated grows
The religious landscape of the United States has undergone major changes since 2008. As the share of registered voters who are religiously unaffiliated has increased, the share who identify as Christian has declined. More than one-quarter (28%) of voters identify as religiously unaffiliated today, up from 15% in 2008; those who identify as Christian decreased from 79% to 64% in that same period. (Data on religious affiliation dates to 2008; prior to that, Pew Research Center asked a different question about religious affiliation that is not directly comparable to its current measure.)
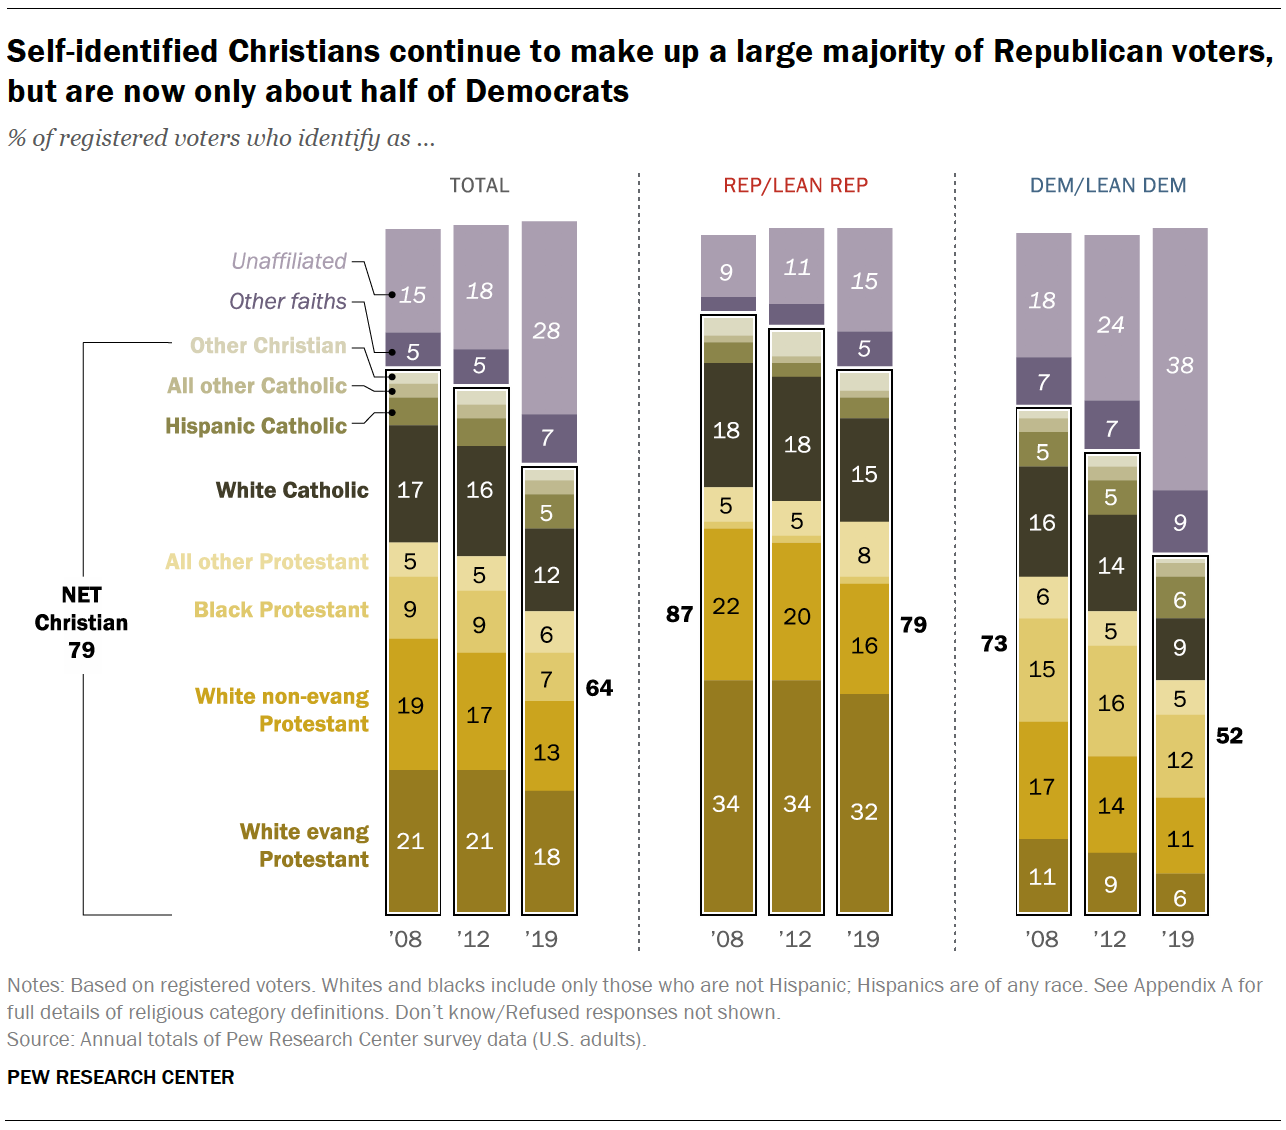
The largest declines among Christian voters have come from among white Christians. The shares of voters who are white evangelical Protestants (21% in 2008 vs. 18% today), white non-evangelical Protestants (19% vs. 13%) and white Catholics (17% vs. 12%) have all declined.
Religiously unaffiliated voters make up 38% of Democratic voters. This has roughly doubled since 2008, when this group made up 18% of Democrats. Over this period, the share of Democratic voters who are Christians has declined from 74% to 52%. White non-evangelical Protestants accounted for 17% of Democratic voters in 2008 but 11% today. There have also been similar declines in the shares of Democrats who are white evangelical Protestants, black Protestants and white Catholics.
White Christians continue to make up a large majority of Republican voters. White evangelical Protestants are about a third (32%) of Republican voters, unchanged from 2008. However, the shares who are white non-evangelical Protestants (22% in 2008 vs. 16% today) and white Catholics (18% vs. 15%) have decreased.
While religiously unaffiliated voters do not make up as large a share of Republicans as Democrats, they do make up a growing share of GOP voters. Today 15% of Republican voters do not identify with a religion, up from 9% in 2008.


