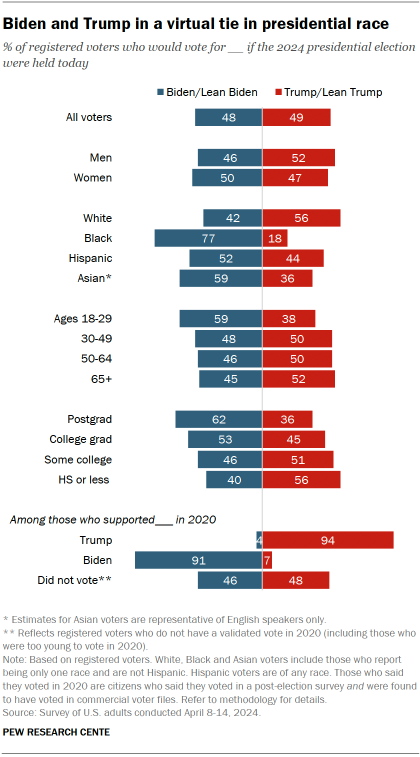
The presidential contest between President Joe Biden and former President Donald Trump stands at a virtual tie: A nearly identical share of registered voters say they would vote for Trump (49%) as say they’d vote for Biden (48%).

As in recent national elections, there are wide differences in candidate support by voters’ gender, age, race and ethnicity, and education.
Gender
Both women and men are largely split in their preferences, though men (52%) are somewhat more likely than women (47%) to say they’d vote for Trump.
Race and ethnicity
A 56% majority of White voters say they would vote for Trump, while 42% back Biden. By comparison, most Black voters (77%) and Asian voters (59%) say they would vote for Biden.
About half of Hispanic voters (52%) say they would vote for Biden, and 44% say they would vote for Trump.
Age
About six-in-ten voters under 30 (59%) say they would vote for Biden if the election were held today, while 38% would back Trump. About half of voters in all other age groups say they would vote for Trump.
Among 2020 voters
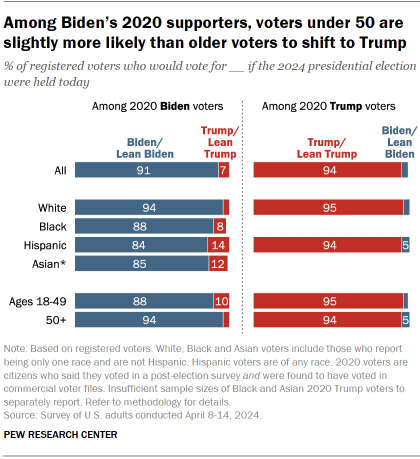
While overwhelming majorities of 2020 Trump and Biden voters say they will support the same candidate again in 2024, those who supported Biden four years ago are slightly more likely to say they would switch their vote if the election were held today.
Among those who voted for Biden in 2020, 7% say they would vote for Trump if the election were held today. This compares with 4% of Trump 2020 voters who say they would vote for Biden today.
Among registered voters who did not vote in 2020, preferences are divided: 46% back Biden, while 48% back Trump.
Educational differences in candidate support
Education has been a major factor in politics and partisan identification for decades. (Explore educational differences in party identification in our detailed report, “Changing Coalitions in a Politically Divided Nation.”)

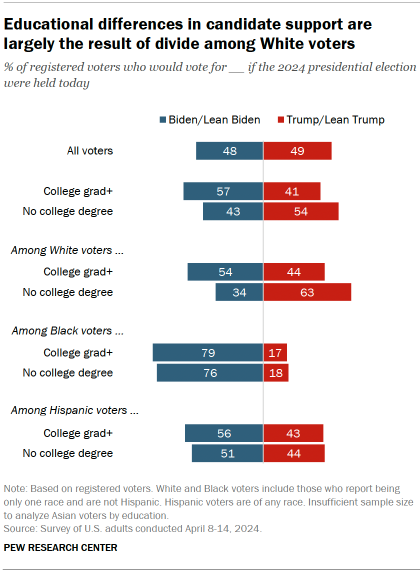
A majority of voters with a four-year degree or more education (57%) support Biden. By contrast, a comparable majority (54%) of those who do not have a college degree say they would vote for Trump if the election were held today.
This gap largely reflects an educational divide among White voters: 54% of White voters with at least a four-year college degree say they would vote for Biden, and 44% would vote for Trump.
Meanwhile, White voters without a four-year college degree are almost twice as likely to say they’d vote Trump (63%) than to say they’d vote Biden (34%).
The educational differences in candidate preferences among White voters are much wider than those among Black and Hispanic voters. Sizable majorities of Black voters with a four-year degree (79%) and without a degree (76%) say they’d back Biden if the election were held today.
And comparable shares of Hispanic voters who have a college degree (56%) and those who do not (51%) also favor Biden.
What are 2020 voters’ preferences today?
Unsurprisingly, overwhelming shares of those who voted for Trump (94%) and Biden (91%) in 2020 continue to support the same candidate today.

Still, small shares have changed their preference, particularly among some subgroups. Currently, 10% of registered voters ages 18 to 49 who supported Biden in 2020 now favor Trump or lean toward Trump.
When looking at voters by race and ethnicity, nearly all White voters who voted for Biden in 2020 – 94% – say they’d still support him today. Smaller majorities of Black (88%), Hispanic (84%) and Asian (85%) voters who supported Biden four years ago say the same.
There are not differences among 2020 Trump voters in 2024 preferences by race and ethnicity or age.
(Vote preference data was collected in November 2020. Visit Pew Research Center’s 2020 validated voters study for more information.)
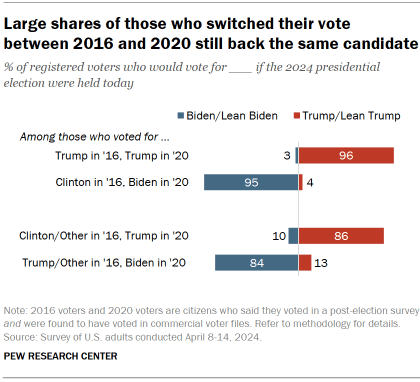
Most voters who changed their vote in 2020 are favoring their 2020 candidate
An overwhelming share of voters who voted for Trump in both 2016 and 2020 (96%) say they would vote for him again in 2024. A similarly large share of voters who voted for Hillary Clinton in 2016 and Biden in 2020 (95%) say they would vote for Biden again today.

Voters who switched their candidate preference between 2016 to 2020 are also overwhelmingly likely to still support their 2020 candidate, though somewhat smaller shares say this.
For example, an 86% majority of voters who supported Trump in 2020 but voted for someone else in 2016 say they would vote for Trump again in 2024.
A similar 84% majority of Biden’s 2020 voters who backed someone else in 2016 say they would vote for Biden again in 2024.


