
Majorities of Americans see a role for government on several safety net issues.
- 65% say the government has a responsibility to ensure all Americans have health care coverage.
- 55% say government aid to the poor does more good than harm.
- 79% say Social Security benefits should not be reduced in any way.
Views on the effect of government aid to the poor
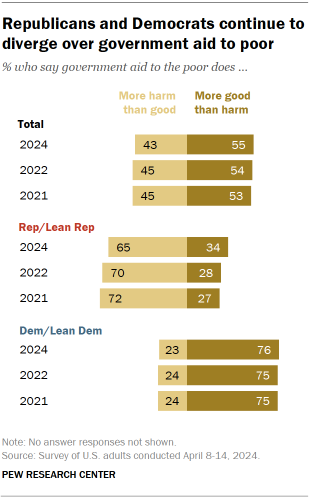
A majority of Americans (55%) say that, overall, government aid to the poor does more good than harm, while about four-in-ten (43%) say it does more harm than good.
Republicans and Republican-leaning independents continue to be critical of government aid to the poor:
- 65% say government aid does more harm than good, while 34% say it does more good than harm.
- However, the share of Republicans saying government aid has a positive effect is up 6 percentage points since 2022.
As in past years, about three-quarters of Democrats (76%) say government aid to the poor has an overall positive effect (23% say it does more harm).
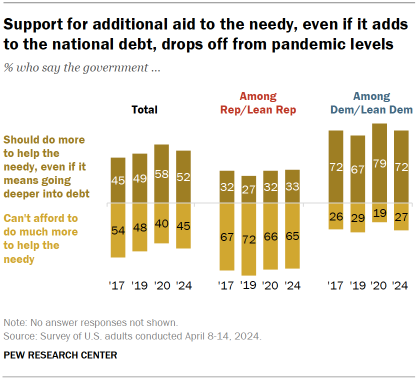
About half of Americans (52%) now say the government should do more to help the needy, even if it means going deeper into debt. By comparison, 45% say the government can’t afford to do much more to help the needy.
Support for doing more to help those in need, even if the debt increases, is 6 percentage points lower than it was in June 2020, in the early months of the COVID-19 pandemic.
- About seven-in-ten Democrats (72%) say the government should do more to help the needy, down from 79% who said the same in 2020.
- A far smaller share of Republicans – 33% – say the government should do more even if it leads to additional debt. Views among Republicans are largely unchanged since 2020.
Government assistance to people in need
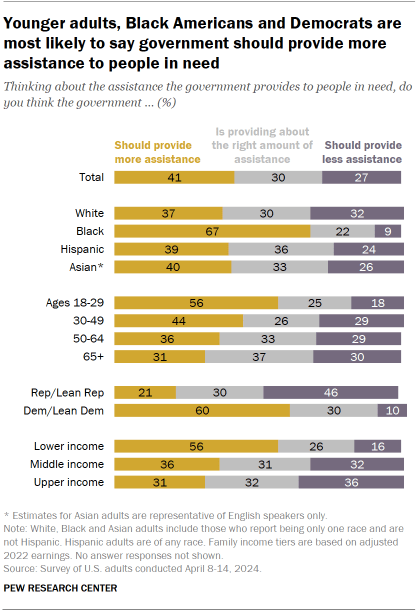
About four-in-ten Americans (41%) say the government should provide more assistance to people in need, while about a quarter say it should provide less (27%). Three-in-ten say the government is providing about the right amount of assistance.
Like other attitudes about social safety net policies, there are wide partisan differences.
Six-in-ten Democrats say the government should provide more assistance to people in need. Just one-in-ten say it should provide less, while three-in-ten say the current level is about right.
By comparison, 46% of Republicans say the government should provide less assistance, while 21% say it should provide more.Three-in-ten say the government is providing the right amount of assistance.
There are other demographic differences:
- Two-thirds of Black adults say the government should provide more assistance to people in need, while smaller shares of Asian (40%), Hispanic (39%) and White (37%) adults say the same.
- Younger adults are more likely than older adults to say the government should provide more assistance.
- A majority of lower-income adults (56%) say the government should provide more assistance. Smaller shares of middle- (36%) and upper-income (31%) adults say the same.
Views on government’s role in health care
About two-thirds of Americans (65%) say it is the federal government’s responsibility to make sure all Americans have health care coverage, while roughly a third (34%) say it does not.
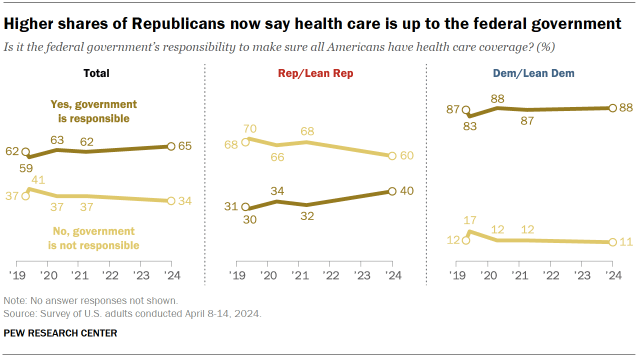
Americans are slightly more likely to say it is the government’s responsibility to ensure health care coverage for all than they were a few years ago (62% in 2021). While Democratic opinion has not changed over this period, the share of Republicans who say government has this responsibility has grown.
- Four-in-ten Republicans and Republican-leaning independents now say it is the government’s responsibility to ensure health care coverage for all, up from 32% who said this in 2022. Six-in-ten say it is not the government’s responsibility, down from 68% who said the same three years ago.
- Democrats and Democratic leaners overwhelmingly hold the view that the government has a responsibility to ensure health care coverage: 88% say this. Democrats’ views on this question are largely unchanged in recent years.
Views by party and income
Majorities of adults at all income levels say the government is responsible for ensuring health care coverage. However, lower-income adults (73%) are more likely than upper- (63%) or middle-income (62%) adults to say this.
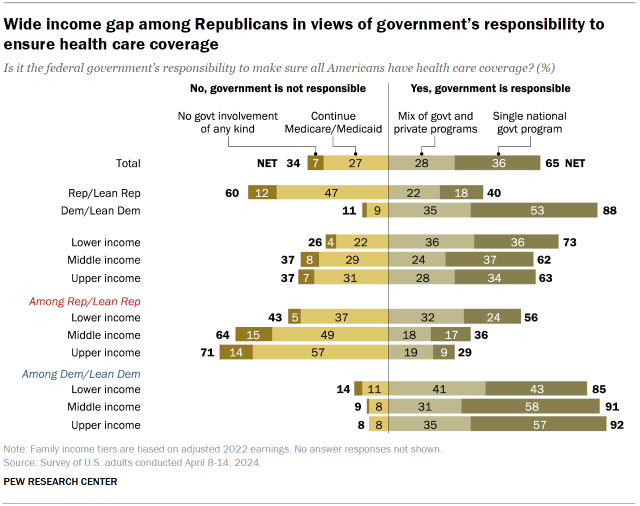
Among Republicans, there are differences within income groups on whether government is responsible for ensuring all Americans have health care coverage:
- 56% of lower-income Republicans say it is the government’s responsibility to make sure all Americans have health care coverage, including about a quarter (24%) who say this should be done through a single national government program.
- Middle-income (36%) and upper-income Republicans (29%) are far less likely to say the government has a responsibility to ensure people have health care coverage. Majorities in both of these groups say it is not the government’s responsibility.
By comparison, more than eight-in-ten Democrats across all income levels say the government is responsible for ensuring all Americans have health care coverage.
- Overall, about half of Democrats (53%) say this should be done through a single national government program. About six-in-ten upper-income (57%) and middle-income (58%) Democrats say this, compared with about four-in-ten lower-income Democrats (43%).
Views on the future of Social Security
Americans overwhelmingly (79%) say Social Security benefits should not be reduced in any way, including four-in-ten who say it should cover more people with greater benefits. Roughly two-in-ten (19%) say some future reductions need to be considered.
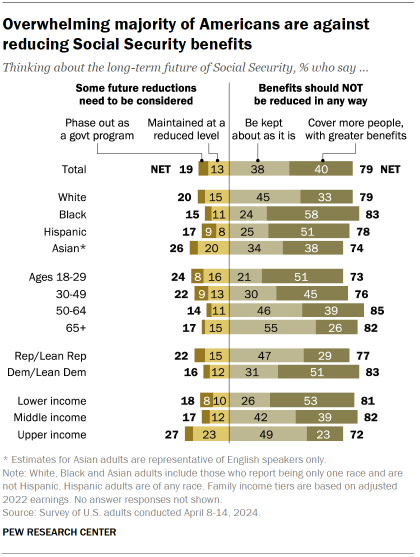
Wide majorities of both Republicans and Democrats do not support Social Security benefit reductions: 77% of Republicans and 83% of Democrats say Social Security benefits should not be reduced in any way.
However, Democrats (51%) are more likely than Republicans (29%) to say Social Security should be expanded.
Across demographic groups there is broad opposition to Social Security benefit cuts. But there are more sizable differences in support for expanding benefits:
- Black (58%) and Hispanic (51%) adults are more likely than White (33%) and Asian (38%) adults to say benefits should be expanded.
- Older adults are less likely than those in other age groups to say benefits should be expanded to cover more people with greater benefits: 26% of those 65 and older say this. By comparison, adults under 30 (51%) are most likely to favor expansion.
- Lower-income adults are the most supportive of expanding Social Security benefits: 53% say this, compared with 39% of those in middle-income families and 23% of upper-income adults.


