
Note: A new report is available as of Aug. 26, 2024: “The Political Values of Harris and Trump Supporters.” The report and its accompanying detailed tables update the material in this report, examining how these issues are viewed by supporters of Kamala Harris and Donald Trump.
Vote preference used in the new report was measured in a survey conducted Aug. 5-11, 2024, after Joe Biden had exited the presidential race. The values data in the new report was measured in the same survey used in this report, conducted April 8-14.
The patterns of opinion in the new report are largely the same as those discussed in this report (which used Biden/Trump preferences as of April).
Pew Research Center conducted this study to understand Americans’ attitudes about U.S. government, such as its size and role.
This report is based primarily on a survey of 8,709 adults, including 7,166 registered voters, from April 8 to 14, 2024. Some of the analysis in this report is based on a survey of 8,638 adults from May 13 to 19, 2024.
Everyone who took part in these surveys is a member of the Center’s American Trends Panel (ATP), an online survey panel that is recruited through national, random sampling of residential addresses. This way nearly all U.S. adults have a chance of selection. The survey is weighted to be representative of the U.S. adult population by gender, race, ethnicity, partisan affiliation, education and other categories. Read more about the ATP’s methodology.
Here are the questions used for the report and its methodology.
While the economy, immigration and abortion have emerged as major issues in the 2024 election, Joe Biden and Donald Trump also have dramatically different ideas about the size and role of government.
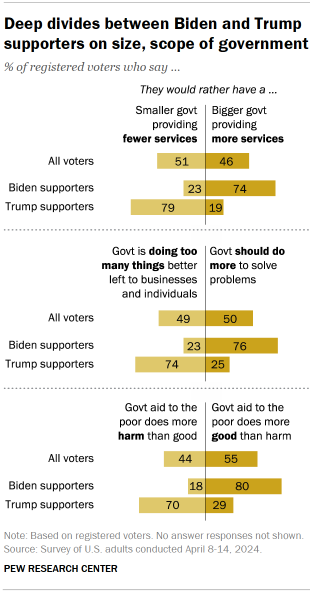
These differences reflect decades-old divisions between Democrats and Republicans over the scope of government.
Among registered voters, large majorities of Biden supporters – roughly three-quarters or more – favor a bigger, more activist government.
- 74% say they would rather have a bigger government providing more services.
- 76% say government should do more to solve problems.
- 80% say government aid to the poor “does more good than harm.”
Trump supporters, by comparable margins, take the opposing view on all three questions.
The Pew Research Center survey of 8,709 adults – including 7,166 registered voters – conducted April 8-14, 2024, examines Americans’ views of the role and scope of government, the social safety net and long-term trends in trust in the federal government.
Democratic support for bigger government is little changed in the last five years but remains higher than it was a decade ago. Republicans’ views have shifted less over the last 10 years.
Among all adults, about three-quarters of Democrats and Democratic-leaning independents favor a bigger government, up from about six-in-ten in 2014 and 2015. The share of Republicans and Republican leaners who prefer a bigger government has increased only modestly over the same period.
Democratic support for bigger government, while slightly lower than in 2021 (78%), remains at nearly its highest level in five decades. During Bill Clinton’s presidency in the 1990s, fewer than half of Democrats said they preferred a bigger government with more services.
Voters continue to express very different views about government’s role in specific areas than about the government generally.
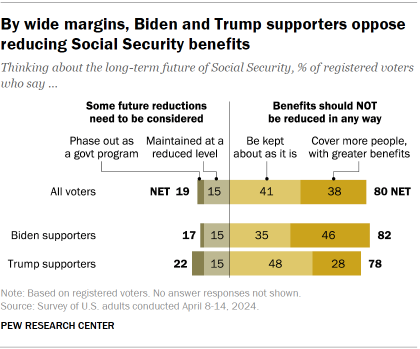
A large majority of voters (80%) – including 82% of Biden supporters and 78% of Trump supporters – say that in thinking about the long-term future of Social Security, benefits should not be reduced in any way.
However, Biden supporters are more likely than Trump supporters to say Social Security should cover more people with greater benefits.
- 46% of Biden supporters favor expanding Social Security coverage and benefits, compared with 28% of Trump supporters.
Most Americans (65%) continue to say the federal government has a responsibility to make sure all Americans have health care coverage.
Democrats overwhelmingly (88%) say the federal government has this responsibility, compared with 40% of Republicans.
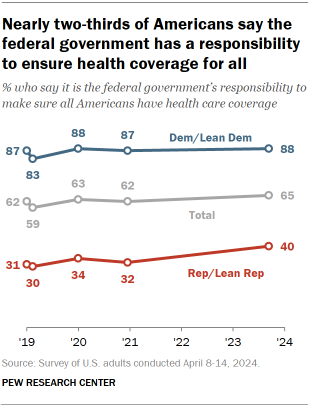
The share of Republicans who say the government has a responsibility to provide health coverage has increased 8 percentage points since 2021, from 32% to 40%.
There are wide income differences among Republicans in opinions about the government’s role in health care:
- 56% of Republicans with lower family incomes say the government has a responsibility to provide health coverage for all, compared with 36% of those with middle incomes and 29% of higher-income Republicans.
When asked how the government should provide health coverage, 36% of Americans say it should be provided through a single national program, while 28% say it should be through a mix of government and private programs. These views have changed little in recent years.
Democrats continue to be more likely than Republicans to favor a “single payer” government health insurance program (53% vs. 18%).
Other key findings in this report
- Americans’ trust in the federal government remains low but has modestly increased since last year. Today, 22% of American adults say they trust the government to do what is right always or most of the time, which is up from 16% in June 2023.
- While the public overall is divided over the nation’s ability to solve important problems, young adults are notably pessimistic about the country’s ability to solve problems. About half of Americans (52%) say the U.S. can’t solve many of its important problems, while 47% say it can find a way to solve problems and get what it wants. Roughly six-in-ten adults under age 30 (62%) say the nation can’t solve major problems, the highest share in any age group and 16 points higher than two years ago.


