Terminology in This Report
“Limited English-speaking” students refers to Census Bureau data on students who report speaking a language other than English at home and who say they speak English “well,” “not well” or “not at all.” English language learner (ELL) students are designated by public schools as students who cannot excel in an English language classroom. Designation procedures vary across states and school districts but often include a test of the student’s English reading and writing skills as well as listening and speaking abilities.
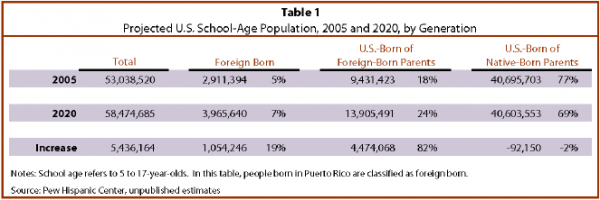
English language learners (ELL) have been and will likely continue to be one of the fastest-growing student groups in the nation’s public schools. Although ELL students are not identical to limited English-speaking students, the percentage of school-age children with limited English speaking abilities nearly doubled from from 2.8% in 1979 to 5.4% in 2005 (NCES, 2007c), reflecting increased immigration to the U.S. Looking to the future, the Pew Hispanic Center projects that the number of school-age children will increase by 5.4 million from 2005 to 2020.3 All of the growth will be composed of children of immigrants (Table 1). Since about one-in-five school-age children of immigrants have limited English-speaking abilities, compared with one-in-100 native-born children of native-born parents (Federal Interagency Forum on Child and Family Statistics, 2005), the number of enrolled children with limited English-speaking abilities will likely continue to increase.

Schools will designate many, if not most, of these children as English language learners. These decisions will depend on individual school and school district policies rather than a single nationally accepted definition of English language learners. Nevertheless, the nature of the future growth of children in public schools indicates that the ELL student population is likely to continue to increase in size. The continued growth of the ELL student population will present large challenges for some public schools and school districts in meeting requirements of the No Child Left Behind Act. NCLB mandates that all groups of students, including ELLs, meet state proficiency standards in mathematics and reading by 2014. Recent results from national and state assessments indicate that ELL students are among the groups least likely to meet state proficiency standards. One of the fastest-growing groups of students is also one of the lowest-achieving student groups in both mathematics and reading.
This report uses newly available school-level assessment data (the National Longitudinal School-Level State Assessment Score Database) to identify one significant source of the relatively poor academic achievement of ELL students: the schools that ELL students attend. Until recently, it was possible to compare ELL students’ academic achievement with other students’ performance based only on their assessment test scores statewide. As a result of the assessment test mandates of NCLB and the requirement that the test results be publicly disclosed, it is now possible to know in which public schools ELL students are enrolled and how well they performed on math and reading assessment tests compared with other students in the same school.
This report examines the contribution of low-achieving public schools to the relatively poor academic achievement of ELL students. It quantifies the extent of concentration of ELL students who take the assessment tests in particular public schools. It then demonstrates that part of the ELL achievement gap is due to the concentration of ELL test-takers in particular schools.
Using the school-level assessment data, the report also shows that white and black test-takers scored lower if they were educated at public schools in which ELL students were concentrated. Finally, it examines possible explanations for the relatively low overall achievement levels at public schools in which ELL students were concentrated by examining some of the other characteristics of these public schools.
The assessment data analyzed is the National Longitudinal School-Level State Assessment Score Database. Funded by the U.S. Department of Education, the NLSLSASD collects the state testing results from about 90,000 public schools and records them in a uniform format. The most recent year available is assessment data from the 2004–05 school year. Further details on the NLSLSASD are discussed in Appendix A.
More than two-thirds of ELL students were educated in six large states: California, Texas, New York, Florida, Illinois and Arizona. The analysis of ELL achievement in this report focuses on ELL assessment test-takers in these six states. In the NLSLSASD, very few Illinois public schools reported their ELL assessment test scores and thus Illinois was excluded from the analysis.
NCLB mandated annual statewide tests for students in grades 3 through 8 beginning with the 2005–06 school year. The analysis presented in this report examined proficiency scores for those six grades. For simplicity of presentation, results for an early elementary grade (typically grade 3) are reported as well as a middle school grade (typically grade 8).4
Since analyses of ELL students’ performance on assessment tests indicate that ELL students demonstrate greater proficiency in mathematics than in reading/English language arts and do not trail as far behind their white and black peers in math proficiency compared with reading/English language arts proficiency, this analysis exclusively examines mathematics achievement.
Even though the NLSLSASD collects data from all 50 states, it is important to note that each state designs and administers its own mathematics assessment and determines the proficiency level necessary to meet the state standard. All students within a state were administered the same mathematics assessment and thus comparisons of the percentage of test-takers at or above the proficient level within a state are valid. However, because students from different states were administered different tests and proficiency levels vary across states, student performance and achievement gaps cannot be compared across states.


