Latinos in the U.S. describe their identity in many ways, reflecting the diversity of origins in the Latino community, the immigrant experience and geography. Broadly, some Latinos use pan-ethnic terms such as “Hispanic” or “Latino” to describe their identity; some prefer their family’s Hispanic origin group; others use “American”. Previous Hispanic Trends Project surveys have found that most Latinos have used all of these at some point to describe themselves (Pew Research Center’s Hispanic Trends Project, 2009; Pew Research Center’s Hispanic Trends Project, 2002).
The Pew Research Center survey finds that among all Hispanics, a family’s Hispanic origin group is by far the most frequent way Hispanics describe their identity. But views of identity and the terms Hispanic use differs some by Hispanic origin and other demographic factors.
How Hispanics Describe Their Identity
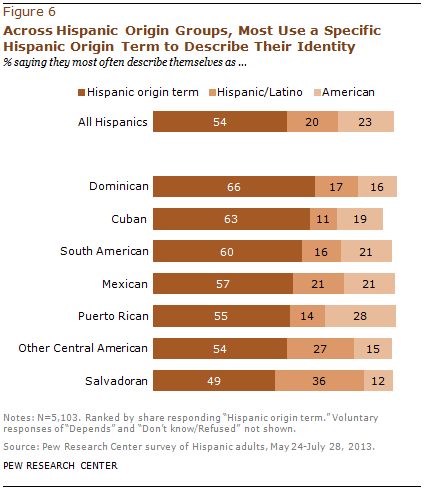
When describing their identity, more than half (54%) of Hispanics say they most often use the name of their ancestors’ Hispanic origin (such as Mexican, Dominican, Salvadoran or Cuban). An additional 23% say they describe themselves most often as “American.” And one-in-five (20%) most often use the pan-ethnic terms of “Hispanic” or “Latino” to describe their identity.
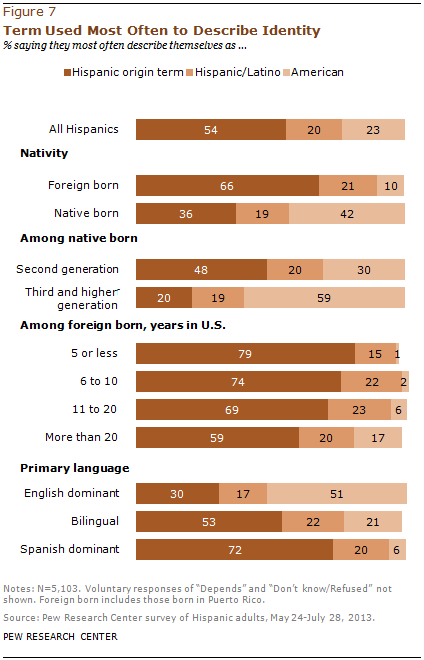
Across Hispanic origin groups, about half or more in each group say they most often use their Hispanic origin term to describe their identity, though preferences for “Hispanic” or “Latino” differ. Among Dominicans, two-thirds (66%) say they use the Hispanic origin term “Dominican” most often to describe themselves. Among Cubans, 63% say they use the term “Cuban” most often, among Hispanics of Mexican origin 57% say they use “Mexican” most often, and among Puerto Ricans, 55% say they use “Puerto Rican” most often. Among Salvadorans, about half (49%) most often use “Salvadoran” to describe themselves.
While many Hispanics most often use their family’s origin term to describe themselves, there are differences across Hispanic origin groups in the use of other identity terms. For example, among Puerto Ricans, 28% say they most often describe themselves as “American,” a higher share than any other Hispanic origin group. (People born in Puerto Rico are U.S. citizens by birth.) By contrast, among Salvadorans, just 12% say they most often describe themselves as “American.” In the case of the pan-ethnic terms “Hispanic” or “Latino,” Salvadorans are more likely than any other Hispanic origin group—36%—to say they use these terms most often to describe themselves.
Nativity and immigrant generation are also linked to the terms that Hispanics use to describe themselves. Among all Hispanics, two-thirds of immigrants and 36% of the native born most often use the name of their family’s origin term to describe themselves.
This pattern is also true among Hispanic origin groups. In the case of Mexican-origin Hispanics, 70% of the foreign born usually use the term “Mexican” to describe themselves, compared with 39% of U.S.-born Hispanics of Mexican origin. For Puerto Ricans, among those born on the island (or in another country outside the U.S.), 74% most often use the term “Puerto Rican” to describe themselves. Among Puerto Ricans born in the 50 states or D.C., just 42% do the same.
Half (48%) of second-generation Hispanics most often describe themselves by their family’s Hispanic origin name. Among third-generation Hispanics, that share is just 20% while six-in-ten (59%) usually use the term “American” to describe themselves.
For immigrant Hispanics, the use of country of Hispanic origin to describe identity is lower among those who have been in the U.S. longer than it is among those who have more recently arrived. For example, among those who have been in the U.S. for more than 20 years, 59% use their specific Hispanic origin to describe their identity. By comparison, eight-in-ten (79%) immigrant Hispanics who have lived in the U.S. for five years or less most often use their specific Hispanic origin to describe themselves.
The terms used to describe identity are also connected to language. Seven-in-ten (72%) Spanish-dominant Hispanics most often use their Hispanic origin term to describe themselves. Among bilingual Latinos, this share is 53%. And among English-dominant Latinos, 30% do the same. But among English-dominant Latinos, half (51%) use the term “American” to describe their identity.
Hispanic or Latino? Most Don’t Care
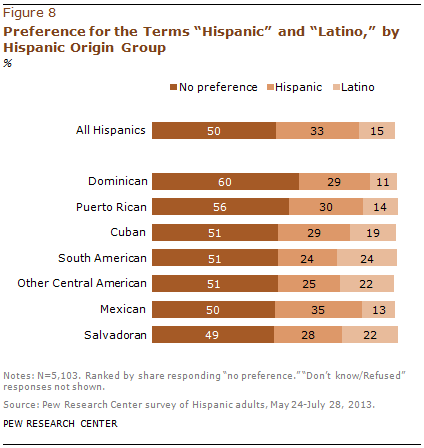
As other Hispanic Trends Project surveys have found (Taylor, Lopez, Martínez and Velasco, 2012), Hispanics have no preference between the two pan-ethnic terms most commonly used to describe the Hispanic community. According to the 2013 survey, when asked which term they prefer, half (50%) of Hispanics say they have no preference between the two. Among those who do have a preference, “Hispanic” is preferred to “Latino” by two-to-one (33% versus 15% of all respondents).
Across Hispanic origin groups, there are some differences in preferences. Six-in-ten (60%) Dominicans say they have no preference for either term, 29% prefer “Hispanic” and 11% say they prefer “Latino.” By contrast, among Hispanics of South American origin, half (51%) say they have no preference for either term, but opinions are split when it comes to preferences for “Hispanic” or “Latino”—24% prefer Hispanic and 24% prefer Latino. A similar pattern is present among Salvadoran-origin Hispanics—half (49%) have no preference between “Hispanic” or “Latino,” 28% prefer Hispanic and nearly as many (22%) prefer Latino. The same is true among other Hispanics of Central American origin.
Preferences for “Hispanic” or “Latino” differ depending on demographic characteristics. Half of all immigrant Latinos (49%) say they have no preference for either pan-ethnic term.
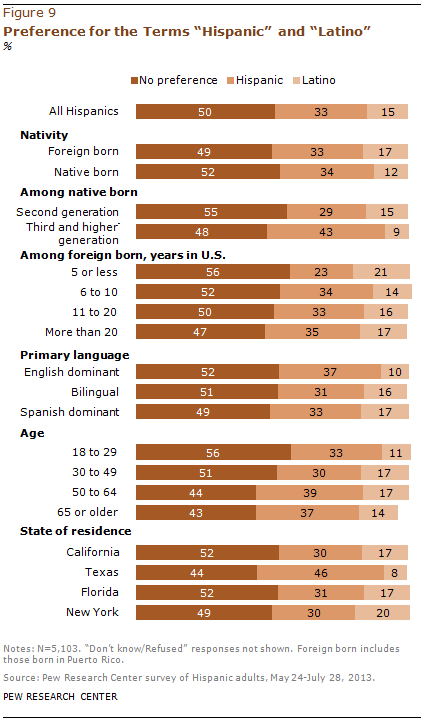
Similarly, age is related to use of pan-ethnic terms. Some 56% of young Latinos say they have no preference for either term. Among Latinos ages 65 and older, just 43% say the same. But no matter which age group is examined, among those who prefer a term, “Hispanic” is preferred over “Latino.”
In California, the most populous Hispanic state with more than 14 million Hispanics, among those with a preference, “Hispanic” is preferred over “Latino” (30% versus 17% of all respondents). Even more so, in Texas, the second most populous Hispanic state, “Hispanic” is preferred to “Latino” among those with a preference by about 6-to-1—46% versus 8%. In addition, Texas is the only one of the largest Hispanic states where just as many prefer the term “Hispanic” (46%) as say they have no preference for either term (44%). In Florida and New York, preference for “Hispanic” over “Latino” looks much like California, with “Hispanic” the preferred pan-ethnic term among those who have a preference.
Typical American or Not?
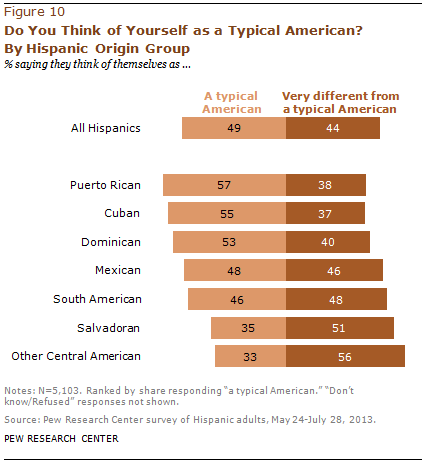
Hispanics are split on whether they think of themselves as a “typical American” or “very different from a typical American.” According to the survey, 49% of Hispanics say the former, while 44% say the latter.
Puerto Ricans are among the most likely Hispanic origin group to say they think of themselves as a typical American, with 57% saying this while 38% say they think of themselves as very different from a typical American. (People born in Puerto Rico are U.S. citizens by birth.) Among Cubans, 55% say they see themselves as a typical American, while 37% say they think of themselves as very different from a typical American.
By contrast, just 35% of Salvadorans say they think of themselves as a typical American, while 51% say they are very different from a typical American. And among other Central American Hispanics in the U.S., one-third (33%) say they think of themselves as a typical American, while 56% say they are very different from a typical American.
Among Mexicans and South Americans, views are split. Half (48%) of Mexicans say they think of themselves as a typical American, while 46% say they think of themselves as very different from a typical American. Among South Americans in the U.S., those shares are 46% and 48%, respectively.
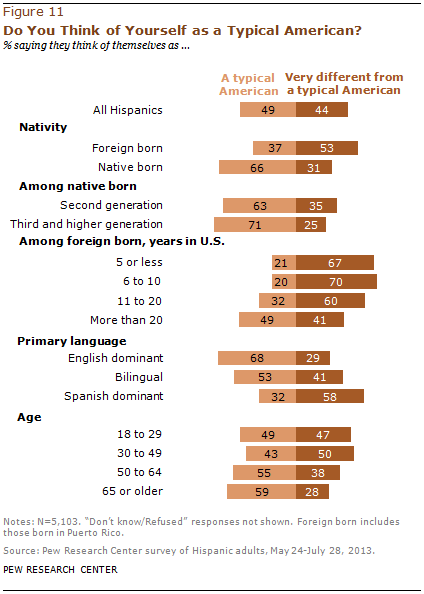
Views about whether people think of themselves as a typical American or not also vary by demographic subgroups within the Hispanic community. For example, two-thirds of native-born Hispanics say they think of themselves as a typical American, while just 37% of foreign-born Hispanics say the same.
The share of native-born Hispanics who say they think of themselves as a typical American rises through the generations. Six-in-ten (63%) second-generation Hispanics say they think of themselves as a typical American, as do 71% of third-generation Hispanics.
For Hispanic immigrants, the share that thinks of themselves as a typical American rise with time in the U.S. Among immigrants who have been in the country for five years or less, 21% say they think of themselves as a typical American while 67% say they think of themselves as very different from a typical American. By contrast, among Hispanic immigrants who have been in the U.S. for more than 20 years, a greater share (49%) say they think of themselves as a typical American, and 41% say they think of themselves as very different from a typical American.
Two-thirds (68%) of English-dominant Hispanics say they think of themselves as a typical American. That share falls to 53% among bilingual Hispanics and just 32% among Spanish-dominant Hispanics.
Views vary by age as well. Among young Latinos ages 18 to 29, 49% say they think of themselves as a typical American, while 47% say they think of themselves as very different from a typical American. Among those ages 30 to 49, these shares are 43% and 50%, respectively. Pluralities of Hispanics ages 50 to 64 and ages 65 and older say they think of themselves as a “typical American”—55% and 59%, respectively.
